Categories
News Transportation

Cincinnati Ranks as Top Bike City

The 2016 biennial list from Bicycling.com shows Cincinnati ranked 36th out of 50 bike-friendly US cities. The ranking is determined by variables such as the number of bicycle facilities, bicycle-friendly businesses, bike-share programs, and the length and safety of infrastructure, amongst others. This year and since 2014, Cincinnati has seen a dramatic increase in bikeability, due to Red Bike and the Central Parkway bike lane, being hailed the 3rd fastest growing biking community in the US. Even with our successes, Cincinnati has fallen from last year’s rank of #35. So, why the fall from #35?

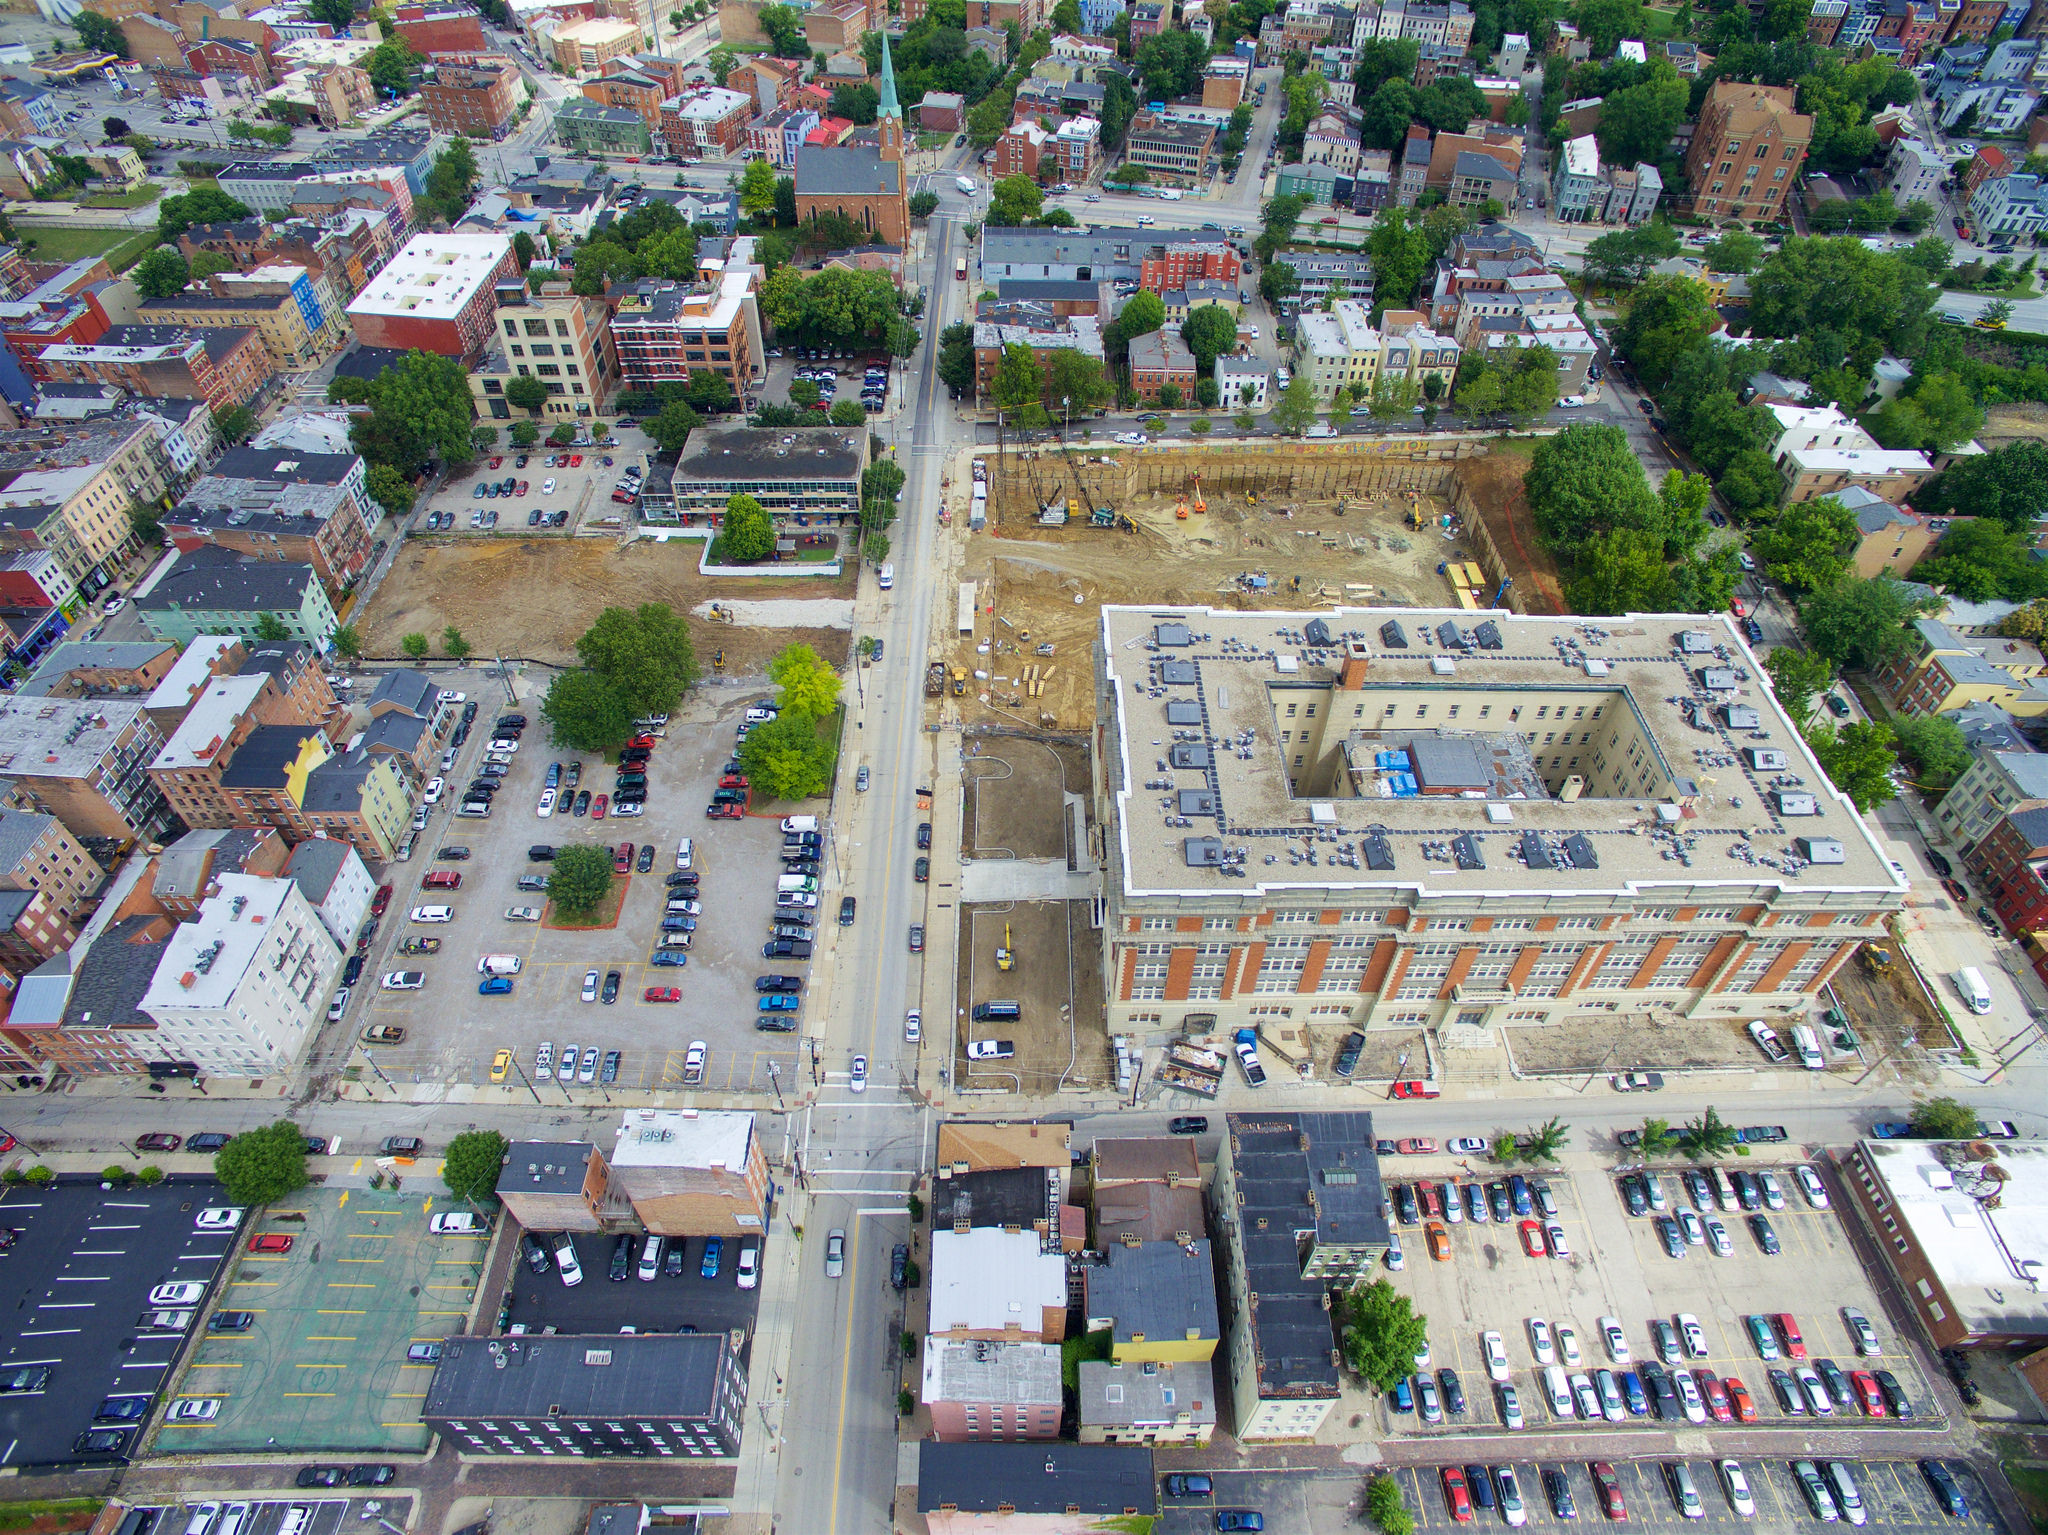
Bicycling.com claims the lack of progress on the City’s Bicycle Transportation Plan, adopted in 2010, coupled with the increasing urban population, with little access to bicycle infrastructure, for the decrease. This year, the first 4.1 miles of the potentially 7.6 mile Wasson Way was purchased just prior to the release of the biennial list. The first phase implementation of the trail, which is scheduled for next year could positively affect the city’s standings in future rankings. However; future on-street connections to the new trail would further boost the city’s access to bicycle infrastructure.

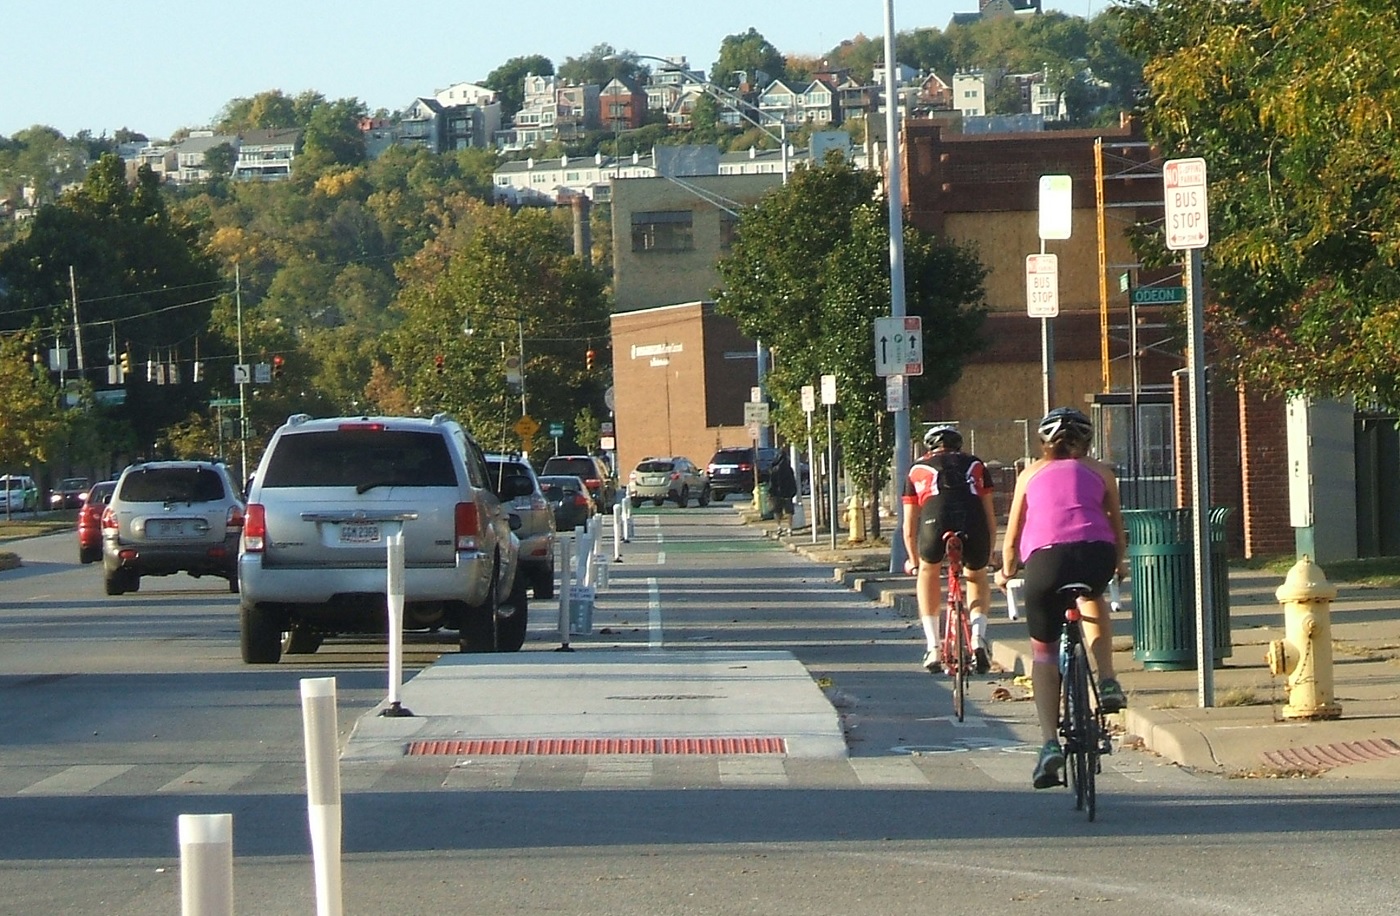
The Central Parkway Protected Bike Lane

This could mean that our rank will increase in coming years. With 100,000 people living within one mile of Wasson Way, the potential for new cyclists and trail-servicing businesses are high and will undoubtedly affect the bike friendliness of the city.

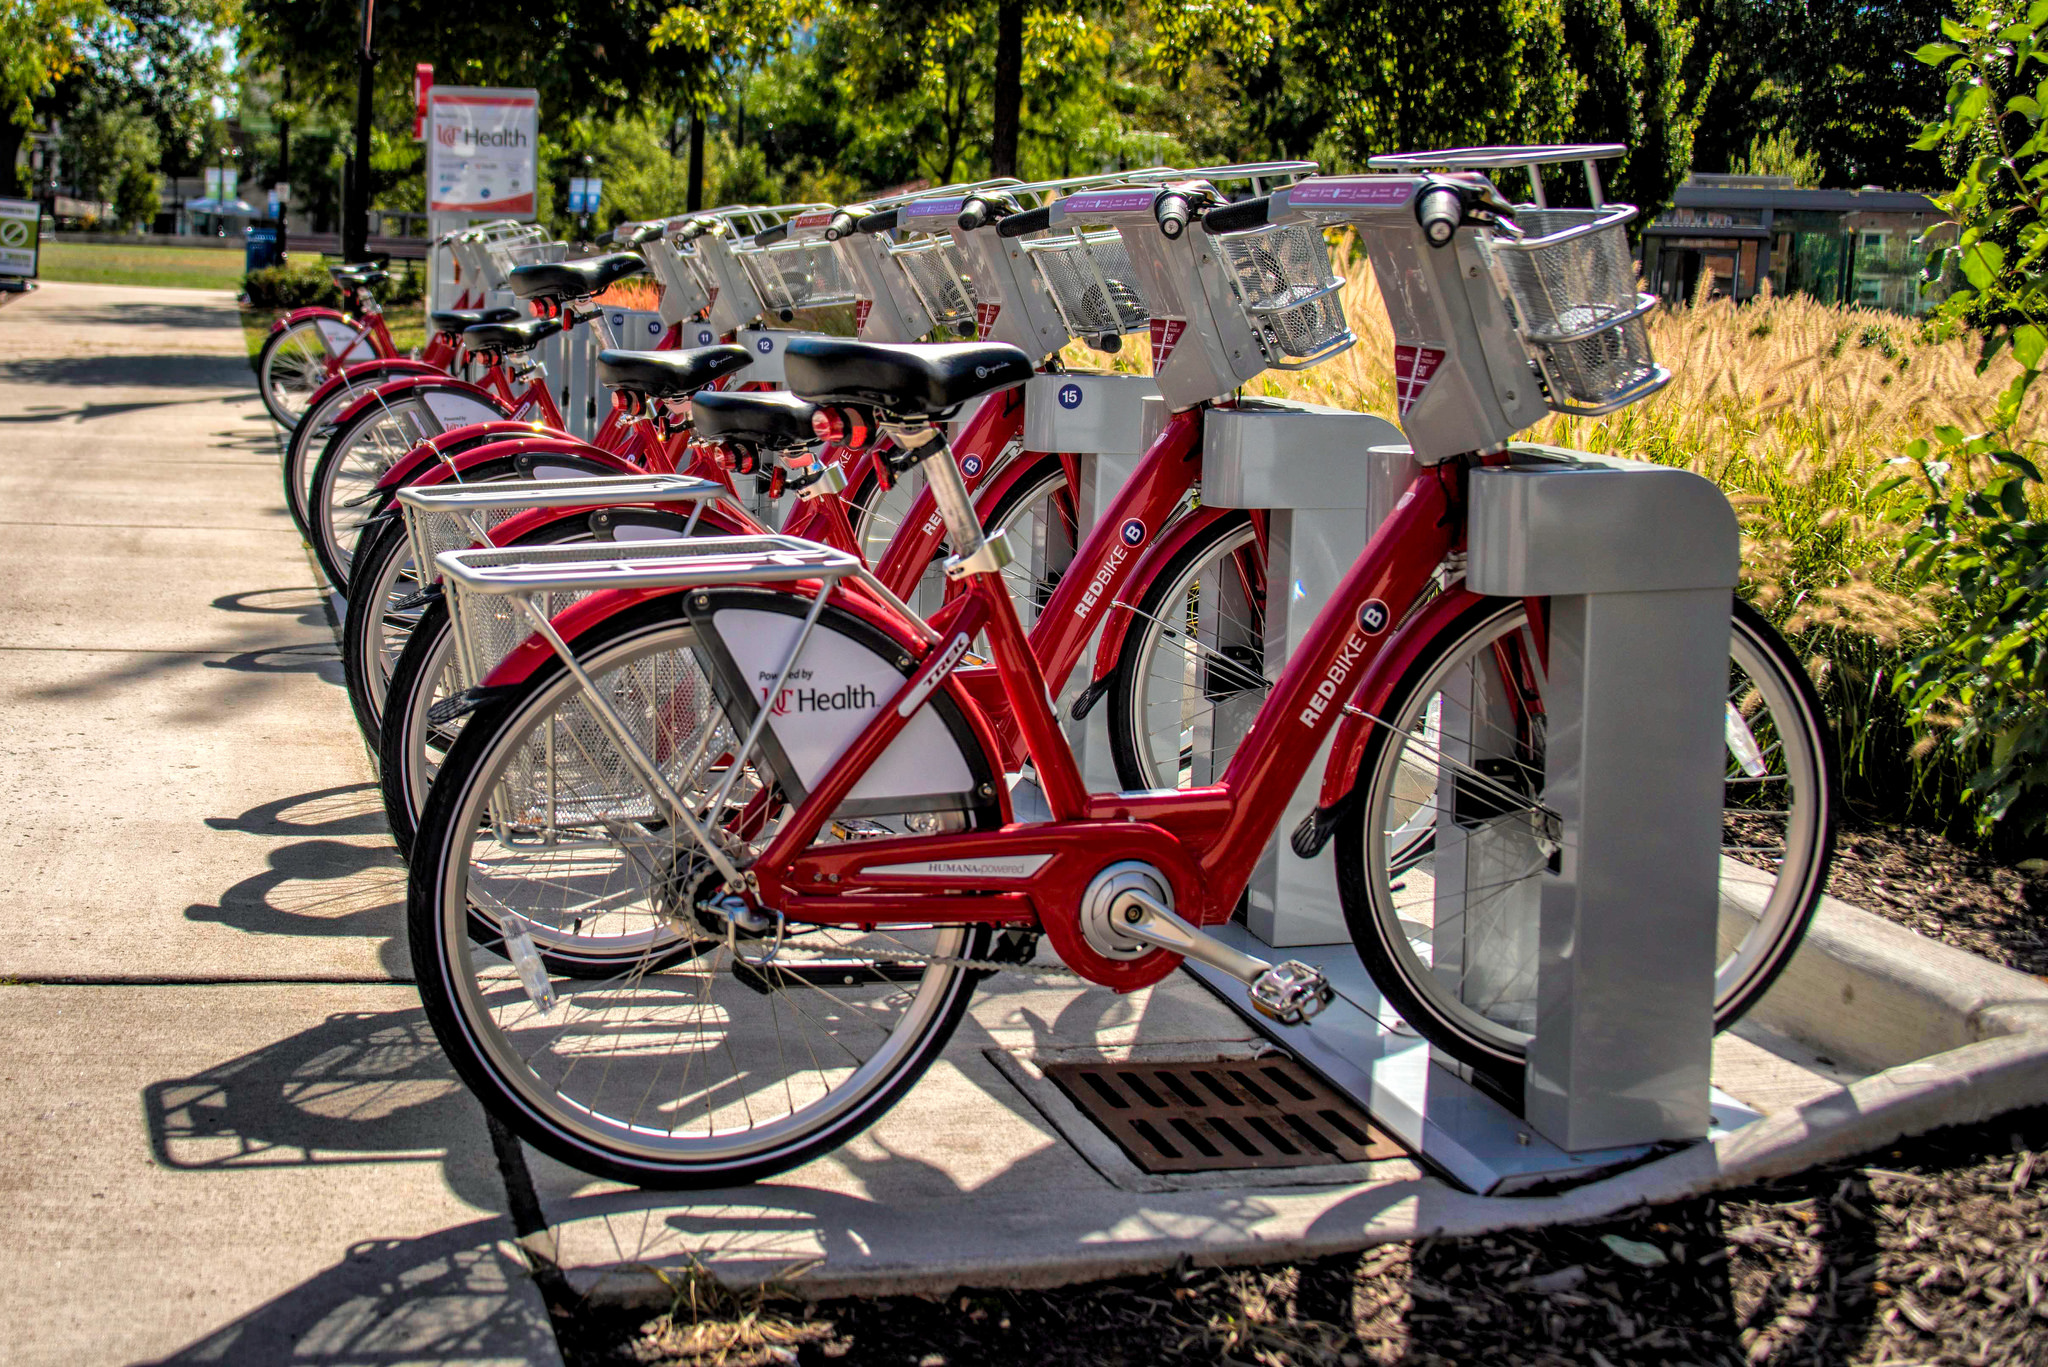
Plans are also underway to secure $21 million in funding to create 42 miles of bike paths, in order to connect Wasson Way, Oasis Trail, Mill Creek Greenway and the Ohio River Trail West. This project is known as Cincinnati Connects and if it passes, will further the city’s bikeability. Additionally, Cincy Red Bike has been an ongoing success; their annual installation of new stations, since its inception in 2014, has added to the momentum of Cincinnati’s bike friendliness.

Although change is afoot, Cincinnati still lacks the complete designation of being ‘bike friendly’ by its residents and outsiders, like those at the top of Bicycling.com’s list. When locals are asked about their view towards biking in Cincinnati, it’s still met by most with negativity: seen as an annoyance, while others are very concerned for their safety while cycling in the city. Cars still dominate the roadways, with some even parking in the bike lane along Central Parkway.

With the new year around the corner, Cincinnati appears to be on a continued path to being a top bike-friendly city however; the following issues are key: residents being made aware of the benefits and safety of cycling; continued implementation of the 2010 Bicycle Master Plan; and policy changes that mirror those cities at the top of the biennial list.

Categories
Development News

New Western Hills Viaduct Could Arrive in Late 2020’s

City officials recently unveiled plans for a new Western Hills Viaduct to replace the 84-year-old structure.

Built in 1931, the viaduct serves as the West Side’s main connection to the city’s urban core. “It affects everybody,” said Cincinnati City Engineer Richard Szekeresh, the project manager. Over 71,000 vehicles cross the bridge every day. However, a city study back in 2012 highlighted the bridge’s deteriorating structural conditions and the poor pedestrian and bicycle accessibility.

The current viaduct is a car haven. Vehicles zoom by a single, narrow sidewalk along the southern edge and cyclists are rare. According to Department of Transportation and Engineering officials, the new structure will be pedestrian- and bicycle-friendly and built to light rail specifications.

Wester Hills Viaduct NewNew cable-stayed design presented by DOTE

Design

Heading west, the current bridge passes over Interstate 75, the CSX Queensgate rail yard, and then deposits cars onto Queen City Avenue in South Fairmont. Queensgate posed a significant problem for the engineers because they couldn’t shut down a privately-owned and high-trafficked rail yard for several years. “We had to find a way to build only from above,” said Szekeresh.

Two design features overcome this constraint. First, the cable-stayed bridge (shown in the renderings) has large distances between its support towers that (mostly) avoid the yard. Second, the physical structure consists of several interlocking parts, meaning the builders can simply insert the relevant pieces into place without much delay. Some rail lines will still be affected, but never for more than a few hours.

Traffic concerns ensure the old bridge will remain in use until its replacement is erected just to the south. The Ohio Department of Transportation (ODOT) must acquire several land parcels. All of them have been appraised, but ODOT must complete its environmental review before it can purchase the properties.

Funding

Total project cost hovers around $310 million, a substantial hike from the city’s previous estimate of $240 million. Federal funds will cover 80 percent, with the city, county, and state covering the remaining funds. Szekeresh indicated that the project could receive a $20 million Transportation Review Advisory Council grant from the Ohio Department of Transportation.

When federal funding will arrive, however, is unclear. Extensions to the projected 2028 end date may be necessary, especially if President-elect Trump reneges on his promise to improve infrastructure.

After the presentation ended, Szekeresh conducted an informal poll to gauge support for the design. Most community members raised their hands in affirmation.

Categories
Arts & Entertainment News

Gallery to Highlight How People Use Space

Space, the final frontier… This famous phrase immediately evokes thoughts of stars and interplanetary travel, but there is a more common type of space that we navigate every day. That space, or the creative utilization of space in the built environment is the highlight of a new gallery exhibit at GBBN Architects’ EDGE Gallery this Friday.

The exhibit titled, “’C’mon Space! Whatcha Gonna Do For Me?” features the work of GBBN in researching common space through pop-up public space interventions. The exhibition will include a collection of diagrams, video, imagery, digital and physical models that summarize the findings of the research; a chronicle of the journey of our research project; and present the successes and failures of typical common space.

CmonSpaceGallery

The idea to focus on how people interact with spaces is the evolution of a project that began in September 2016 with GBBN’s annual participation in PARK(ing) Day. PARK(ing) Day is an international event where individuals and groups take over public parallel parking spaces for a day and transform them into miniature parks called “parklets.” UrbanCincy has covered this event over the years.

Initially PARK(ing) Day was used as a vehicle to perform initial research on how people use and respond to pop-up lounge seating. After this years’ event, the firm continued the research by creating a series of pop-up interventions that presented other seating options and interactive exhibits and observed how people interacted to the options.

The EDGE gallery is a place to share GBBN’s research and participate in local design dialogue. The gallery name was inspired from the meaning of an ‘edge condition,’ which occurs where two or more distinct realms overlap and interface to create a unique situation. Conditions such as these allow for fertile and creative thought, and elicit unique challenges and opportunities to create lively discussions.

The exhibition will be held at the EDGE Gallery located at 332 East 8th Street in the 8th Street Design District from 6pm-9pm on Friday December 2. A Cincy RedBike station is conveniently located across the street. The gallery is also located along the #11, #16, and #64 Metro Bus routes and is two blocks from the 8th and Main Cincinnati Bell Connector stop.

Categories
Development News

New Market Tax Credits Key to City’s Revival

Cincinnati’s development coffers got a little fatter last week, as $125 million in federal tax subsidies flooded into the city. These subsidies, called New Market Tax Credits (NMTCs), incentivize local investors to funnel capital into low-income communities and have essentially bankrolled Over-the-Rhine’s entire revitalization.

For example, Washington Park — perhaps the most emblematic example of OTR’s rebirth — received nearly $14 million in New Market Tax Credits (NMTC) from the Local Initiatives Support Coalition (LISC) to help support its reconstruction. Several ongoing developments have also received some or all of their funding through NMTCs, including the Market Square and Ziegler Park projects.

Ziegler Park Aerial
New Market Tax Credits helped transform parts of Over-the-Rhine like the reconstruction of Ziegler Park (Photo by Travis Estell)

Developers often balk at the prospect of developing low-income communities because they fear their investment will be wasted. NMTC are the federal government’s attempts to allay these concerns. Congress first authorized the subsidies through the Community Renewal Tax Relief Act of 2000. Over the past fifteen years, the bill’s success has earned it bipartisan support. According to the program’s 2016 report, the tax credits have created 750,000 jobs and invested over $75 billion to businesses and revitalization projects in communities with high rates of poverty and unemployment.

Less than 25 percent of the applications submitted each year are awarded, but three major Cincinnati developers beat the odds this year: Cincinnati Development Fund ($65 million), Uptown Consortium (45 million), and the Kroger Community Development Entity ($15 million).

To win an NMTC grant, a corporation — in federal parlance, Community Development Entities (CDE) — must lobby the U.S. Treasury’s Community Development Financial Institution (CDFI) Fund on behalf of private investors like the Cincinnati Center City Development Corporation (3CDC). If the CDFI approves the application, then the investors who pledged money to the CDE will receive a seven-year tax abatement to support development.

3CDC, in particular, has secured a eye-popping $238 million since the program’s inception. Without this capital, it’s unlikely that OTR would have changed as drastically as it has. The community was a no-brainer for NMTC-driven development due to its extreme poverty. The neighborhood’s median household income during the 2010 census was a paltry $14,517. Six years and billions of dollars have certainly improved its lot, but its average income still pales in comparison to the city’s 2015 median income, $56,826.

While OTR will likely continue to receive the majority of NMTC-driven development, other distressed neighborhoods are receiving attention. According to Director of Development Thea Munchel, the Walnut Hills Redevelopment Foundation expects approximately $6.5 million in NMTC Equity for its expected revitalization of Paramount Square. “It is too early to know who all will participate in the deal,” she said. “But Cincinnati Development Fund received a huge award and has indicated that they will contribute some into the project.”

Categories
Development News

Cincinnati Rent Data Reveals Housing Challenges

Renting an apartment in Cincinnati is comparable in price to most of the geographically close and similar-sized cities in the Industrial Midwest and Upper South regions. Apartment-finding website RentCafé investigated the average apartment size and rent in America’s 100 largest cities. Using a baseline of $1,500, the data provides a glimpse America’s most and least-expensive cities.

Cincinnati’s price per square foot comes out to be exactly $1.00 and, with an average apartment size of 863 square feet, the average rent in the city is $866. Cincinnati is identical in price per square foot with St. Louis, MO, although a smaller average apartment size makes the average rent ($839) cheaper in that city. Cincinnati’s average rent is less than in Pittsburgh, PA ($1,070) and Cleveland, OH ($927) but more expensive than Columbus ($800), Indianapolis ($758), and Louisville ($841). Besides Indianapolis and Pittsburgh, most nearby cities remained relatively similar in average rent prices.

rentanalysisohio

RentCafé’s data also shows, unsurprisingly, that New York City, San Francisco, and Boston top the list with average rents coming out to $4,031, $3,275, and $3,111, respectively. Using the baseline of $1,500, you could afford a 271 square foot apartment in New York City, a 342 square foot one in San Francisco, or an apartment with 399 square feet in Boston. Other cities at the top of the list include other expected cities such as Washington, DC, Seattle, WA, and Los Angeles, CA. The cheapest cities for rent in the nation are Memphis, TN, Wichita KS, and Winston-Salem, NC.

Despite rent in Cincinnati and related cities being relatively cheap renters in these cities’ respective counties struggle to afford a decent apartment. Based on data from the National Low Income Housing Coalition (NLIHC), a typical renter household in Hamilton County, OH (Cincinnati) will spend 36.9% of their income to afford a two-bedroom apartment. The NLIHC considers anything more than 30% to be unaffordable. In Marion County, IN (Indianapolis) that number is 35.1%, in Jefferson County, KY (Louisville) it’s 35.5%, 33.9% in Allegheny County, PA (Pittsburgh), and 37.1% in Cuyahoga County, OH (Cleveland). Franklin County, OH (Columbus) comes close to being affordable at 30.4% and St. Louis County barely makes the cut at 29.7%.

While housing crises are well-documented and discussed in America’s booming cities like New York City and San Francisco, this data shows the need for more affordable housing in many of America’s smaller metropolises as well. In fact, looking at the data from the National Low Income Housing Coalition, one would be hard-pressed to find many major American cities that meet the 30% of income threshold set by the NLIHC.