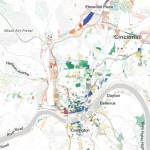
Of the 490,222 workers in Hamilton County, 39% of them are commuters from outside the county. This is according to data released by the U.S. Census Bureau.
Compared to other similarly sized metropolitan areas, this is a larger than normal percentage. In Cuyahoga County, home of Cleveland, for example, only 28% of the almost 700,000 workers commute from outside the county; and in Allegheny County, PA – the center of the Pittsburgh metropolitan area – that number is 22% of more than 680,000 workers.
Hamilton County Commute Patterns [Washington Post]
The difference, some say, may be attributable to the fact that the Cincinnati region’s job center sits directly on a state line, and borders three counties in Northern Kentucky.
However, in Jefferson County, KY, with a similar amount of workers in the county as Hamilton County, only 26% of employees commute from outside Jefferson County. This is in spite of the fact that Louisville sits directly on the Ohio River, like Cincinnati, with commuters crossing the state line from Indiana each day.
Perhaps further explaining the matter is the merging of Cincinnati and Dayton’s economic activities, which increasingly promote cross commuting between Cincinnati’s northern, and Dayton’s southern counties.
Such commuting patterns complicate transportation management for regional planners. Not only does it mean heavy rush hour commutes, but also more unpredictable reverse commutes.
While Hamilton County was a bit of an outlier, it was joined by Davidson County, TN (Nashville), and St. Louis County, MO (St. Louis) with similar complex commuting patterns.
The OKI Regional Council of Governments is in the midst of updating its 2040 Regional Transportation Plan. In the early stages of developing this plan, they region’s designated metropolitan planning organization is looking for feedback regarding the types of transportation and land use policies it pursues over that time.
As of now, agency officials are looking for public feedback in the form of an online survey that takes less than five minutes to complete. It asks the public what kinds of transportation modes should be prioritized, where the region’s transportation network is lacking, whether maintenance or expansion should be prioritized, and how you currently and would like to get around for your daily needs.
Cincinnati [Randy A. Simes]
Planners at OKI say that the results of this public input will help define what types of transportation improvement recommendations are made in June 2016. This is critically important since OKI serves as the regional authority in charge of administering federal transportation dollars.
Over the past four years this has included $86.3 million for 77 roadway projects, $22.9 million for 12 transit capital improvements, and $6.6 million for 15 bicycle and pedestrian projects.
As with any planning exercise, the OKI 2040 Regional Transportation Plan (2016 Update) is based on a number of factors to help guide decision-making.
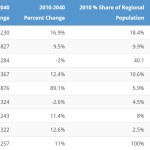
One of the most important baseline factors is population growth and the distribution thereof. For this, OKI is using 2010 Census data, and its preceding decades, as the baseline for future forecasting.
As a result, OKI is projecting that Hamilton County will lose 2% of its population between now and 2040, thus resulting in a loss of regional population share from its 40.1% today, to 35.4% in the future. In fact, based on those prior trends, OKI believes that Hamilton County’s population will stand at approximately 790,000 in 2020 – down from the 802,374 baseline in 2010.
OKI 2040 Population Projections [Provided]
The problem with using these historical trends is that Cincinnati has seen a dramatic turnaround over the past decade – one that has reversed Cincinnati and Hamilton County’s long population loss trend. This has been reflected in the latest population estimates from the U.S. Census Bureau, which say that Hamilton County has actually gained population since 2010, and now has approximately 806,000 residents. Meanwhile, growth in the region’s outlying counties has slowed down considerably based on historical trends.
This is important because leadership at OKI has consistently said that it needs to continue to accommodate growth in the region’s outlying counties, which means funds that could otherwise be directed toward mobility, safety and maintenance improvements are instead spent on capacity expansion.
While there may be an overstated importance placed on the need for capacity expansion, OKI planners do acknowledge the need to improve the mobility, safety and maintenance of the regional network. Of the plan’s eight stated goals, none of them include, with perhaps the partial exception of Economic Vitality, the need to add capacity.
“In addition to its economic impacts, transportation also plays an important role in the region’s quality of life,” the report states.
“Transportation improvements have an effect on development, travel patterns and opportunities for all the region’s citizens. The transportation system should be balanced so that no group or groups of people assume a disproportionate share of positive or negative impacts.
The survey will remain open until Friday, January 8. After that time OKI officials say that their staff will begin formulating a draft project list to recommend for funding. Once that list is completed, OKI will host five public involvement events in the spring to gather feedback on the recommended projects.
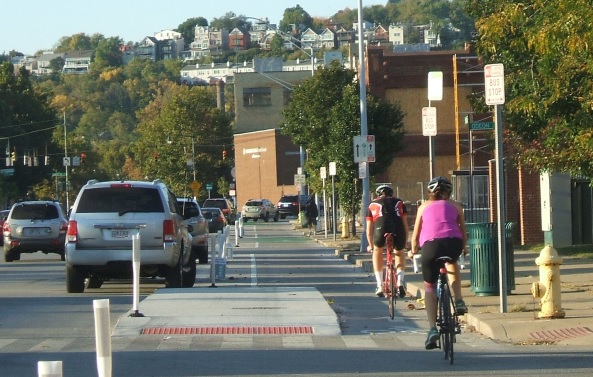
Central Parkway Protected Bike Lane [Eric Anspach]
Newly released data from the U.S. Census Bureau shows that the number of people commuting to work by bike continues to rise all across the United States. The League of American Bicyclists took an in-depth look at these numbers and found that Cincinnati is one of the fastest-growing bicycling cities in America.
According to the data produced by the American Community Survey, Cincinnati has the highest percentage of people commuting to work by bike of any city in Ohio.
This places the Queen City in 31st place for the largest percentage of bike commuters in America. Columbus and Cleveland come in at 36th and 40th, respectfully. Toledo, meanwhile, was the only other Ohio city to crack the top 70 and came in at 67th.
Central Parkway Protected Bike Lane [Eric Anspach]
“Cincinnati is leading the state in establishing bicycle commuting as a viable means of active transportation,” Frank Henson, President of Queen City Bike‘s Board of Trustees, told UrbanCincy. “We are coming to an understanding that bicycle commuting is safe, sustainable and a healthy choice for everyday transportation.”
What is perhaps more telling is that Cincinnati registered the third-fastest growth rate of bicycle commuters in American from 2000 to 2014.
During that four-year period, ACS data shows that Cincinnati saw a 350% increase in its percentage of bicycle commuters, trailing only Pittsburgh (361%) and Detroit (403%), and edging out Portland, OR (307%). Cleveland also clocked in amongst the top ten in this category with a 238% increase; while Columbus registered a 124% increase. For Cincinnati this builds on its impressive showing over the previous decade where it was a Midwest leader.
Industry experts note that a common thread between many of the communities registering the fastest growth rates is increased investment in bike lanes.
In fact, it was in June 2010 when Cincinnati adopted and began implementing its Bicycle Transportation Plan, which calls for 445 miles of on-street and off-street bike paths by 2025. While that plan mostly calls for non-protected bike lanes, best practices have quickly evolved and now protected bike lanes, like the one on Central Parkway, are widely considered the safest and most efficient alternative.
“Ironically, these days when drivers yell at me for riding in the street, they are just as likely to yell ‘Get in the bike lane!’ as ‘Get off the street!”, explained Margy Waller, who helps organize several group bike rides throughout the year. “To me this suggests that drivers understand the value of the bike lane for all street users. Unfortunately, the drivers don’t seem to realize that most streets don’t have a bike lane, but I bet they’d support more of them.”
While the growth in the number of people commuting by bike is impressive, it still accounts for less than 1% of all commute-related trips in Cincinnati. Implementation of the Bicycle Transportation Plan has been important in notching these improvements over the past four years, but that progress has been slow and inconsistent.
Two years ago, University of Virginia researcher Dustin Cable put together a detailed dot map based on the racial distribution of people in the United States. This work inspired another researcher to put together something similar, but for America’s job distribution.
Robert Manduca studies sociology and social policy at Harvard University. He says that while jobs and the economy are continuously discussed, we seem to know very little about where jobs are actually located. So what he did was examine the Census Bureau’s Longitudinal Employer-Household Dynamics data and then plot that information out on an interactive map.
The LEHD data is based on state unemployment insurance records, and tabulates the count of jobs by census block,” Manduca explained on his website. “Here, jobs are colored by type, allowing us to see how different industries and sectors exhibit different spatial patterns–some clustering in downtowns, others spreading across city and suburbs alike.”
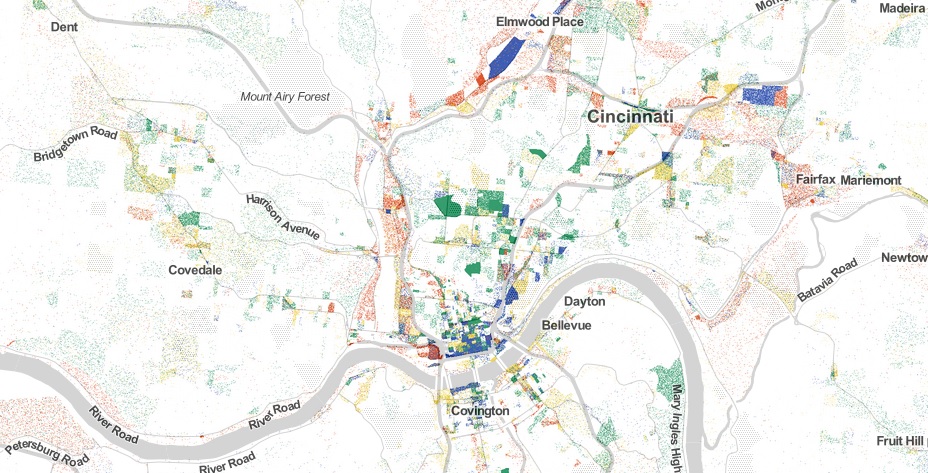
The way the visualization works is that red represents Manufacturing & Trade; blue for Professional Services; green for Healthcare, Education and Government; and yellow for Retail, Hospitality and Other Services.
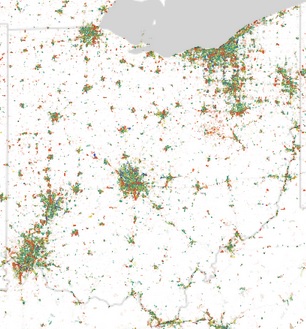
Upon examination of the map, you can see that some cities and regions have a much stronger concentration of jobs than others. When looking at Ohio from a distance, it looks like this pattern holds true for the state’s three big cities. That picture changes as a more detailed look is taken at Manduca’s research.
In Cincinnati, for example, the two largest job centers, downtown and uptown, are joined by the Mill Creek Valley and Blue Ash as areas with heavy concentrations of jobs. As expected, there is a large cluster of education and health jobs uptown, while downtown boasts the region’s heaviest concentration of professional service jobs.
Cincinnati City Employment Dot Map
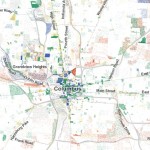
Columbus City Employment Dot Map
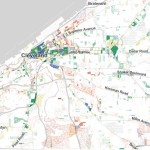
Cleveland City Employment Dot Map
Blue Ash then comes in as, perhaps, the most impressive job center for professional service jobs in the region outside of the center city.
The Mill Creek Valley, which generally runs north along I-75 from the Ohio River, serves as the region’s primary manufacturing and trade corridor. This industrial corridor is well-rooted in Cincinnati’s history, and is even reflected in the City of Cincinnati’s robust tax collections from these zip codes.
The research reveals how much of a barrier the natural landscape serves as when considering job distribution. Throughout the Cincinnati region, for example, you can see how the hills cut across the landscape.
The data also shows that while Cincinnati is often defined by an east/west divide, the distribution of jobs is far more north/south oriented than it is east/west. Of course, the same is true for the region’s population.
These numbers can be misleading, and often don’t even pass the smell test.
Is Jacksonville, for example, really a bigger city than Detroit, Washington DC, Atlanta and Boston? Or out west, would most people actually consider Phoenix to be a larger city than San Francisco, Seattle, Denver or San Diego? Of course not.
Yes, Boston is actually a bigger city than Indianapolis [Emmanuel Huybrechts, Flickr]
No, Indianapolis is not bigger than Washington DC or Atlanta. [Serge Melki, Flickr]
In both scenarios, however, that is precisely the case. That is because the municipal boundaries for Jacksonville (885 square miles) and Phoenix (517 square miles) are disproportionately large compared to the population of their city. Closer to home the same is true for Columbus (223 square miles), Indianapolis (368 square miles) and Charlotte (298 square miles) – all of which skew the average population density for cities east of the Mississippi downward due to their huge municipal footprints.
If you were to simply pick-up a daily newspaper and read the listing of America’s most populated cities, you would not get this full perspective and perhaps be misled to think that Columbus is the biggest city in Ohio, or that Indianapolis is the fifth largest city east of the Mississippi River.
Using this same practice, some might consider Cincinnati to be a small city that doesn’t even crack the top 30 in the United States.
Of course, we know all of this is skewed by all sorts of factors. Some cities sit on state or county lines, others follow historical boundaries from hundreds of years ago that have never changed, while other are granted more liberal annexation capabilities. In short, it’s politics.
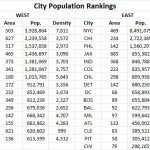
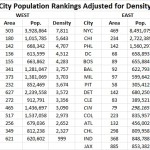
Now if we were to look at America’s 30 most populous cities again, but rank them by population density instead of overall population, the picture would change rather dramatically. Most cities in the west fall considerably, while older cities in the east would rise. The outliers that have artificially inflated their boundaries over the years also fall into a more normalized position on the chart.
While Cincinnati is not in the top 30 in terms of population, we considered it anyways since this is UrbanCincy after all. After adjusting for population density, Cincinnati would vault all the way to the 16th “biggest” city in America, just behind Denver and ahead of Dallas. This is also more in line with Cincinnati’s metropolitan population ranking that falls within the top 30 in America.
Those cities in this analysis that are in the east have an average population density, outliers included, of 6,579 people per square mile, while those in the west, come in at 3,804 people per square mile.
If outliers like Jacksonville actually were as large as they project, and followed the average population density for the region, it would need to add close to 5 million people. Likewise, Indianapolis would need to add around 1.6 million people and Charlotte 1.1 million. Local politics and market conditions in each of these cities will never allow for this many new people to move within city limits.