Categories
Business Development News

Are Regional Population Trends in Cincinnati and Dayton Entangled?

Anyone in this region knows that Cincinnati and Dayton are closely influenced by one another. Perhaps you could say that Cincinnati, being significantly larger, influences Dayton more than Dayton influences Cincinnati, but you might not want to say that to anyone in charge at the Cincinnati-Northern Kentucky International Airport.

A new study conducted by Alberto Hernando de Castro for the École Polytechnique Fédérale de Lausanne in Paris found two trends in the population growth and decline of Spanish cities. His team was able to determine these trends by developing a model based on population data collection from 8,100 Spanish municipalities between 1900 and 2011.

One of the trends Hernando’s team noted in the study was that a city’s growth rate depends on the growth rates of neighboring cities. And it was specifically noted that cities within 50 miles of one another become “entangled” in a way that if one grows, the other grows as well. It is this trend that is perhaps most interesting for the Cincinnati-Dayton metroplex, where the two core cities are less than 50 miles apart.

Cincinnati-Dayton Region Population Change Entanglement

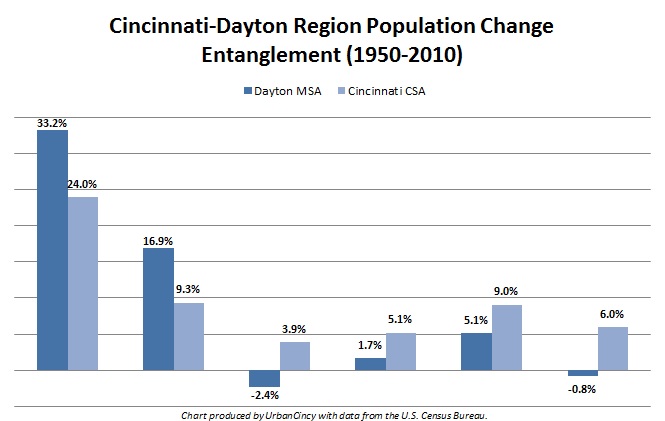
The primary cities of both regions peaked in terms of their population in the middle of the 20th century, but metropolitan area population growth has more or less continued for both up through the 2010 Census.

The Dayton metropolitan statistical area (MSA), with 841,502 people, has suffered two decades of population decline – the first from 1970 to 1980 and the second from 2000 to 2010. The Cincinnati combined statistical area (CSA), meanwhile with 2,172,191 people, has never recorded a decade of population loss.

With that said, the population growth trends for the two cities do tend to mirror one another. From 1950 to 1980 both regions saw their population growth slow significantly, with Dayton leading the way. The two areas then saw an uptick from 1980 to 2000, with Cincinnati leading the way.

If the Cincinnati-Dayton metroplex is in fact following this trend noted by Hernando and is researchers, then it would appear that Dayton’s slowing growth in the middle part of the 20th century brought Cincinnati’s down with it, or whatever factor led to this change in Dayton had similar effects on the nearby Cincinnati market.

The same would be true, but in opposite fashion, for the latter part of the century when Cincinnati’s rebounding population growth seemed to pull Dayton along with it – even reversing the slight population decline the Dayton MSA experienced in the 1970s.

The other trend noticed by the researchers was that cities seem to grow based on a 15-year memory – meaning what happened within the past 10 to 15 years serves as a reasonable indicator for what will happen in the next few years. This analysis, of course, is more accurate the closer the years are to the base year, and less accurate the closer the data is to the 15-year extreme.

If this trend is also true, might it mean that the Dayton MSA will post a population gain between 2010 and 2020, as a result of Cincinnati’s population gains lifting up Dayton’s population decline as it did in the 1980s? Or will it mean that the population gain for the Cincinnati CSA will be even less than the 6% gain posted last decade, as a result of whatever is dragging down population gains in Dayton?

Time will tell, but so far the two noted trends seem to apply to the Cincinnati-Dayton metroplex. In what way, exactly? Good question.

Categories
Business News Politics

UVA Demographer’s Map Illustrates Cincinnati’s Racial Segregation

Dustin Cable, a demographic researcher at the University of Virginia’s Weldon Cooper Center for Public Service, recently published a map of the United States that shows an individual dot for each of the nation’s 308,745,538 people.

On their map each dot was assigned one of five colors based on the racial and ethnic affiliation. Whites are blue; African-Americans, green; Asians, red; Hispanics, orange; and all other racial categories are coded as brown. Cable used publicly available 2010 data from the U.S. Census Bureau.

When viewed in its entirety from afar, the map makes cities look like integrated places with a merging of all the colors to create a purple shade. This, however, is not the most accurate portrait of the racial segregation found throughout American cities.

When viewing Cincinnati at a more detailed level, for example, one can see the clear separation of White, Black, Hispanic and Asian populations.

The dots are evenly distributed throughout their assigned Census Block, so some dots (or people) appear to be living in areas where they cannot (i.e. parks, water, streets).

The specific areas of interest inside Cincinnati city limits are several Uptown neighborhoods where a dense cluster of Asian individuals live, and the Lower Price Hill and East Price Hill area where a small concentration of Hispanic individuals call home.

When looking elsewhere around the region it is also interesting to observe the Hispanic population cluster in Butler County near in and around the City of Hamilton.

Categories
Business News Transportation

STUDY: Suburban Residents Have Longest Commutes in Cincinnati Region

The Cincinnati region scores better in several metrics that most American cities with regards to commuting patterns.

That is according to new study released by the U.S. Census Bureau, Out-of-State & Long Commutes, which shows that Cincinnatians spend three fewer minutes commuting each way when compared to the average American. The study also finds that only 2.9% of Cincinnatians spend more than 60 minutes one-way during their commute, as compared to the 8.1% national average.

The central concentration of jobs and economic power in the Cincinnati region also impacts the distribution of these travel times, with close-in neighborhoods boasting lower commute times and far-flung neighborhoods with the highest.

Cincinnati Commutes

“It is well known that Hamilton County draws a lot of commuters to work,” said Brian McKenzie, a Census Bureau statistician who studies commuting.

The draw of Hamilton County is strong. According to the Bureau, more than 188,000 people commute to and from Hamilton County each day, placing it at the top end of the spectrum in the U.S. Within Hamilton County, however, the East Side has it better off with lower average commute times, by about five minutes, as compared to the West Side.

The study also found that a mere 3.9% of Hamilton County commuters used public transportation in 2011. The rate of public transportation use is slightly lower than the national 5% average, and also does not take into account recent ridership increases that have outpaced national gains.

“The average travel time for workers who commute by public transportation is higher than that of workers who use other modes,” McKenzie continued. “For some workers, using transit is a necessity, but others simply choose a longer travel time over sitting in traffic.”

Due to the lack of a comprehensive regional transit system, approximately 79.3% of Cincinnatians are stuck behind the wheel of a car by themselves, and another 9.2% are carpooling to work each day.

The data for the study came from the American Community Survey (ACS), which collects information on education, occupation, language, ancestry, housing costs and transportation. The ACS has been ongoing in some form since 1850, approximately 60 years after the nation’s first decennial census, and is currently in jeopardy of losing its funding.

“This information shapes our understanding of the boundaries of local and regional economies, as people and goods move across the nation’s transportation networks,” McKenzie concluded.

Categories
Development News Politics Transportation

OKI Survey Results Show Preference for Compact, Walkable Communities

The OKI Regional Council of Governments has released the findings from its 2012 How Do We Grow From Here survey, and is reporting a record response.

According to OKI officials, the survey received 2,474 responses and more than 1,200 comments. In the past, the organization had received around 100 responses for similar surveys, but was hoping for higher numbers this time around due to a larger outreach effort.

The survey is intended to take the pulse of the Cincinnati region with regards to regional vitality, sustainability, and competitiveness with a special focus on land use and transportation policy. The results of the survey are then intended to be used when updating the metropolitan planning organization’s Strategic Regional Policy Plan (SRPP), which was last updated in 2005.

OKI 2012 Survey Results

“While much has been accomplished since the plan’s adoption in 2005, much remains to be done to reach its goals,” state OKI officials. “The SRPP needs to be updated to reflect the impacts of subsequent events such as the Great Recession and significant changes in our demographics, particularly as the baby-boom generation ages.”

Of the survey’s 21 total questions, seven offered particularly revealing insights into the psyche of those from around the region concerning transportation options, economic development strategies, and land use policy.

The survey results indicate a clear preference for sustainable and urban communities. Approximately 60% of respondents said that they felt urban revitalization and neighborhood redevelopment efforts are paying off, and a whopping 88.5% said that it is important to have safe pedestrian and bicycling options in their community.

While the 2,474 respondents stated that they wanted to see existing infrastructure maintained and their communities built in a way to support walking and bicycling, it does not appear that they feel the region is heading in that direction.

“Bicycle infrastructure can play a big role in enhancing public health, providing additional options for transportation, and reducing pollution,” commented one responder. “I also would support a comprehensive transportation plan that includes the extended streetcar line and light rail. This could reduce traffic congestion and pollution and enhance economic growth for our neighborhoods.”

More than a third of those responding said that they feel the region is growing in an unsustainable manner, and more than two-thirds expressed concern about how the region’s housing, transportation, healthcare, and recreation options will support aging individuals and younger generations that desire walkable urban communities.

A 2011 report from Transportation For America found that more than 64% of Cincinnati’s population between the ages of 65 and 79 will have poor transit access by 2015 – ranking the region as the 17th worst out of 48 regions with 1-3 million people.

When asked about energy and the climate, approximately 74% said that rising energy costs have impacted their lifestyle choices surrounding transportation and utilities. With nearly 85% of those same respondents feeling confident about knowing where to go to get more information or help to achieve greater energy efficiency, it appears that organizations like the Greater Cincinnati Energy Alliance are making a positive impact.

“OKI needs to develop renewable energy sources for our area and eliminate all fossil fuel usage in the next 10 years,” responded one individual on the survey. “OKI needs to actively promote the Greater Cincinnati Energy Alliance that has enough funding to upgrade close to 70,000 homes and business in the Hamilton County and northern Kentucky.”

OKI officials state that while they currently have no authority, and seek no authority, over local land use decisions, they hope that the results of their updated SRPP will bring about more consistency between local land use planning and regional transportation planning.

On episode two of The UrbanCincy Podcast we discussed the issue of transportation poverty facing Cincinnati’s aging population, and how unsustainable development patterns are hurting the region’s environment and economy. You can stream our bi-weekly podcasts online for free, or download the podcasts on iTunes.

Categories
News Politics

Cities won the 2012 election for President Obama

President Barack Obama (D) was reelected on Tuesday, November 6. President Obama won approximately 51% of the popular vote, but won in convincing fashion with the Electoral College, earning 332 out of 578 total electoral votes.

Perhaps unsurprisingly, cities appeared to deliver the victory of a second term for President Obama this election season. According to Edison Research, President Obama earned approximately 69.4% of the vote in cities with more than 500,000 people, and 58.4% of the vote in cities with 50,000 to 500,000 people.

Furthermore, with the exception of Jacksonville and Salt Lake City’s home counties, President Obama won the plurality of votes in every major American city. This includes Cleveland, Columbus, Cincinnati, Toledo, Dayton, Akron and Youngstown in Ohio.


The President Obama won all but two counties with major cities, and swept the major demographics that are changing urban American. Map courtesy of The New York Times.

The browning of America
Cincinnati’s traditionally conservative Hamilton County has been trending more liberal over the past decade. Over that same time frame, American cities have seen a long foreseen demographic shift take root.

In 2012, the U.S. Census Bureau found that minority babies are now a majority of those born in the United States, and that 50,000 Hispanics reach voting age every month. Furthermore, 11% of all U.S. counties are now majority-minority, and half of the 40 largest metropolitan regions now have a while population below 60%.

The trends, when compared with the results of the 2012 election, are profound.

According to NEP Exit Poll conducted by Edison Research, President Obama earned the vote of 92.7% of black voters, 70.6% of Hispanic voters, 73.2% of Asian voters, and 57.7% of all other non-white voters. Mitt Romney, however, did earn the vote of approximately 58.7% of white voters.

Not only are these demographic groups growing in numbers, they are increasingly showing up to vote, with both black and Hispanic voters showing up in record numbers for the second consecutive presidential election.

The single, urban woman
Single women are another increasingly powerful force behind the resurgence of cities. There are an estimated 17 million women who live alone in America, and President Obama won that voting bloc by a whopping 39%.

Sociologist Eric Klinenberg attributes the foundation for this demographic shift to larger cultural changes in American society. In his book, Going Solo, he describes the rapid entry of women into the civilian workforce over the past 40 years, the delay of marriage for young people, and the “divorce revolution” that took place during the 1970s.

In short, young people, especially young women, are much different in contemporary America than those from 50 years ago.

According to the U.S. Census Bureau, the number of women in the workforce has grown from 14.8 million in 1967 to 43.2 million in 2009. And in 2009, it is estimated that approximately 30% of all women over the age of 25 have earned a bachelor’s degree or more.

Should these trends continue, the single urban woman may continue to become an even more powerful voting bloc.

With single women and minorities becoming an increasingly dominant portion of 21st century American cities, it may force the hands both major political parties to focus more of their energy on public policies that positively relate to urban voters.