Gentrification is one of those topics that is difficult to write about. Simply mentioning the word or hinting at its existence is sure to stir the pot and draw a wildfire of comments, both defending and condemning it. What is often left out of the discussion, however, is that the gentrification we all imagine in our minds when we hear the word is essentially confined to just three metropolitan regions in America. As a result, the bigger concern for most cities should actually be their widespread poverty. More from Vox:
That share of people living in high-poverty neighborhoods isn’t huge — around 8.9 percent of all Americans living in poverty in 2010, according to US Census Bureau data. But the population of high-poverty neighborhoods has doubled since 1970, from 2 to 4 million. Over that same period, the US population as a whole grew by around 50 percent. In addition, the number of high-poverty census tracts in cities nearly tripled from 1,100 to 3,100.
As City Observatory highlights, we often think of gentrification as a big threat to urban areas, driving up the cost of living for people living in poorer areas and eventually forcing them out. You would think that’d lead to a lot of these neighborhoods rebounding out of poverty, albeit with mixed consequences for people there originally. But it appears the bigger threat by far is neighborhoods remaining mired in poverty and new neighborhoods falling into it.
Many things have changed in America since the golden age of suburbia. The country is now much more diverse and tech-focused, and young people seem to be ignoring The American Dream in a pursuit of their own, newer ideals. One of the relics of The American Dream is the suburban corporate campus, and its death may have just been signaled. More from Better! Cities & Towns:
Smartly clad structures perfectly reflected their pinstripe suited, clean-cut occupants. It was a near perfect match of sociology and architecture. The male breadwinner toiling all day inside a glass box, coming home to the American Dream: a detached “Colonial style” house with a manicured lawn. The Betty Crocker cookbook of that era advised housewives to have a mixed drink ready for their husband’s eagerly expected return, along with tips on how to set a table when the domestic help had the day off. We all know how that dream turned out.
Some Boomers smugly claim that Millennials will fall back into line as soon as they have children. Well, guess what? They aren’t having kids. They aren’t even marrying. Nor are they buying cars. And not because they can’t afford them. They don’t want them.
The folks who run Weyerhaeuser are a smart bunch. I’m sure they started projecting out how long it would be before they would have a difficult time recruiting younger workers to reverse commute.
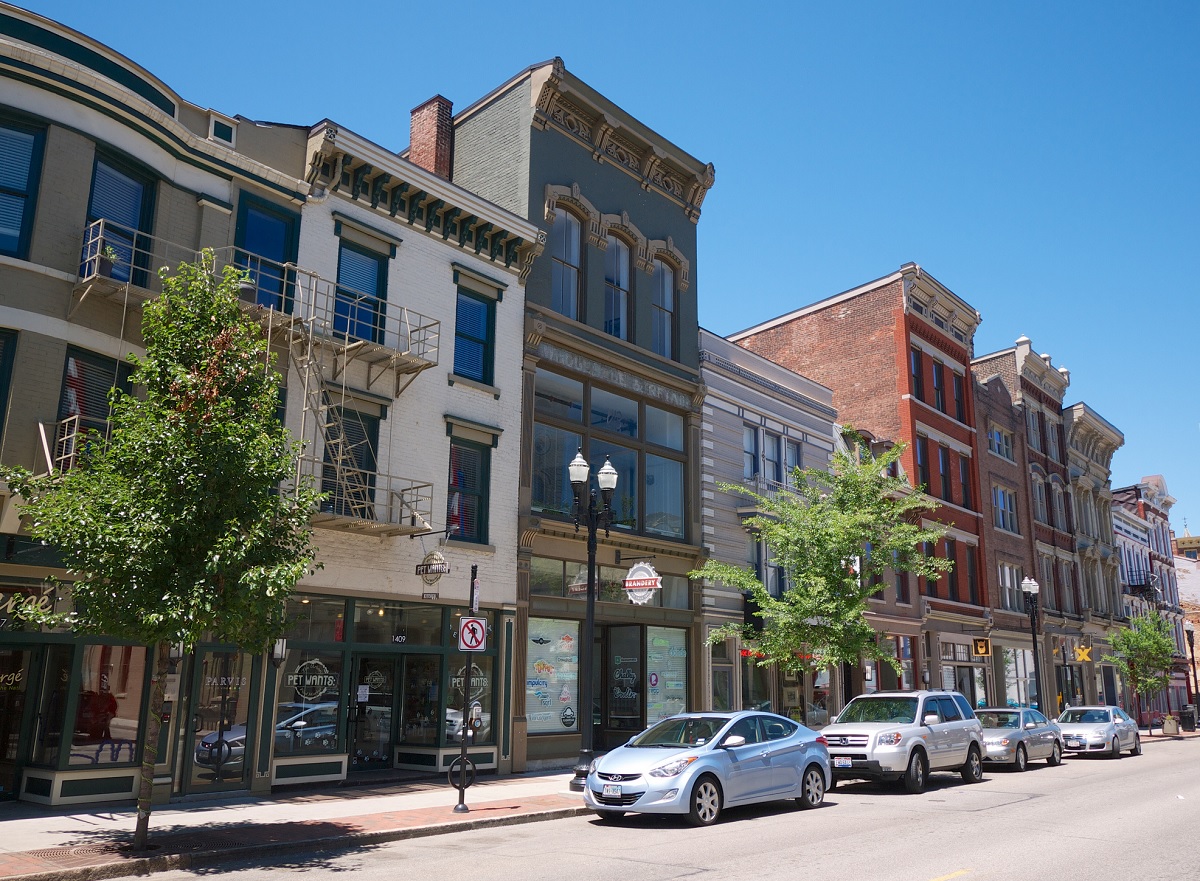
During the housing boom years between 2000 and 2007, many cities saw an influx of new housing and new wealth into their core neighborhoods. It was a trend that was consistent throughout America as wealthier individuals looked to move back into the cities that had been abandoned in prior decades.
This trend was more pronounced in some cities – Atlanta, Washington D.C., Denver, and Seattle – than others. But for the most part, the majority of the cities were gaining wealth relative to their regional average. Following the burst of the housing bubble, however, virtually every city saw this rate of improvement slow down.
According to research from the Federal Reserve Bank of Cleveland, the majority of 59 cities studied now fall between either a one percentile decline or one percentile increase between 2007 and 2010. This is in contrast to the housing boom period which saw cities like Atlanta and Washington D.C. move up 8.7 and 5 percentiles respectively.
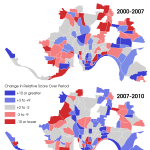
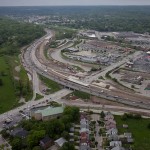
Cincinnati Census Tract Income Changes [Nate Wessel]
“During the housing boom, a number of large cities in the United States experienced redevelopment in their lower-income neighborhoods as higher-income residents moved in, a process known as gentrification,” wrote researcher Daniel Hartley. “Since lending standards have tightened with the onset of the housing bust and the financial crisis, we wondered whether gentrification has continued after the recession in places where it was happening before.”
The results of their research found that only a select handful of regions reasonably continued to see relative wealth growth in their principal cities. The findings also detected one region that bucked the trend and actually increased its gains over the housing boom period.
“Another interesting case is Cincinnati, which barely changed in income ranking from 2000 to 2007 but has increased at a pace similar to Denver or Washington during the 2007 to 2010 period,” the research team noted.
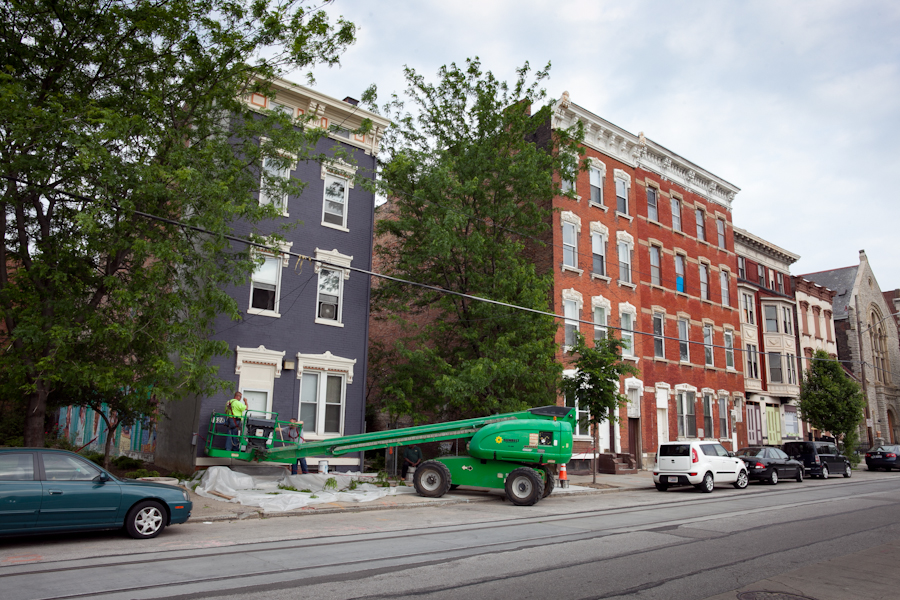
While the gains in wealth may seem like a positive thing for the city, not everyone is so thrilled about the changes taking place in Cincinnati.
“It seems to me what this information really indicates is how, when people experiencing poverty are systematically removed from a certain area, and housing stock is renovated with the goal of selling to wealthier people, property values increase,” says Jason Haap, an area teacher and prominent advocate for the city’s homeless population. “The fact that Cincinnati has seen gentrified growth during a time of slow economic growth in minority communities further exacerbates the situation.”
One of the tools in order to prevent the displacement Haap mentions from happening is including ‘set asides’ in new developments for affordable housing. The Cincinnati Center City Development Corporation (3CDC) has done this a bit in Over-the-Rhine at projects like Mercer Commons and Bremen Lofts, but there is no official city policy or requirement to do so.
What also factors into the relative changes studied by the Federal Reserve Bank is the widespread poverty and low income levels of those living within city limits. Thus, even nominal improvements would show up as a potentially significant increase.
We do know, however, that some housing prices, particularly in the city center where demand is highest, are starting to get out of hand. Most new apartment developments in the Central Business District now feature rents of $2,000 or more per month, and in one recent case, a three bedroom flat on Sixth Street rented for a whopping $4,600 per month.
In such cases it is leaving many now wondering if these prices are not only driving out existing residents but, paradoxically, also preventing many new potential residents from moving in.
“Demand in Cincinnati’s core is insatiable, and supply is only coming online at a trickle,” explained Derek Bauman, an urban development consultant and chairman of Cincinnatians for Progress. “Without urban housing supply, we may miss the coming wave of new residents. At nearly $2 per square-foot rents and $250-$300 a square-foot sales, we may not have Manhattan prices yet, but we’re damn near Brooklyn.”
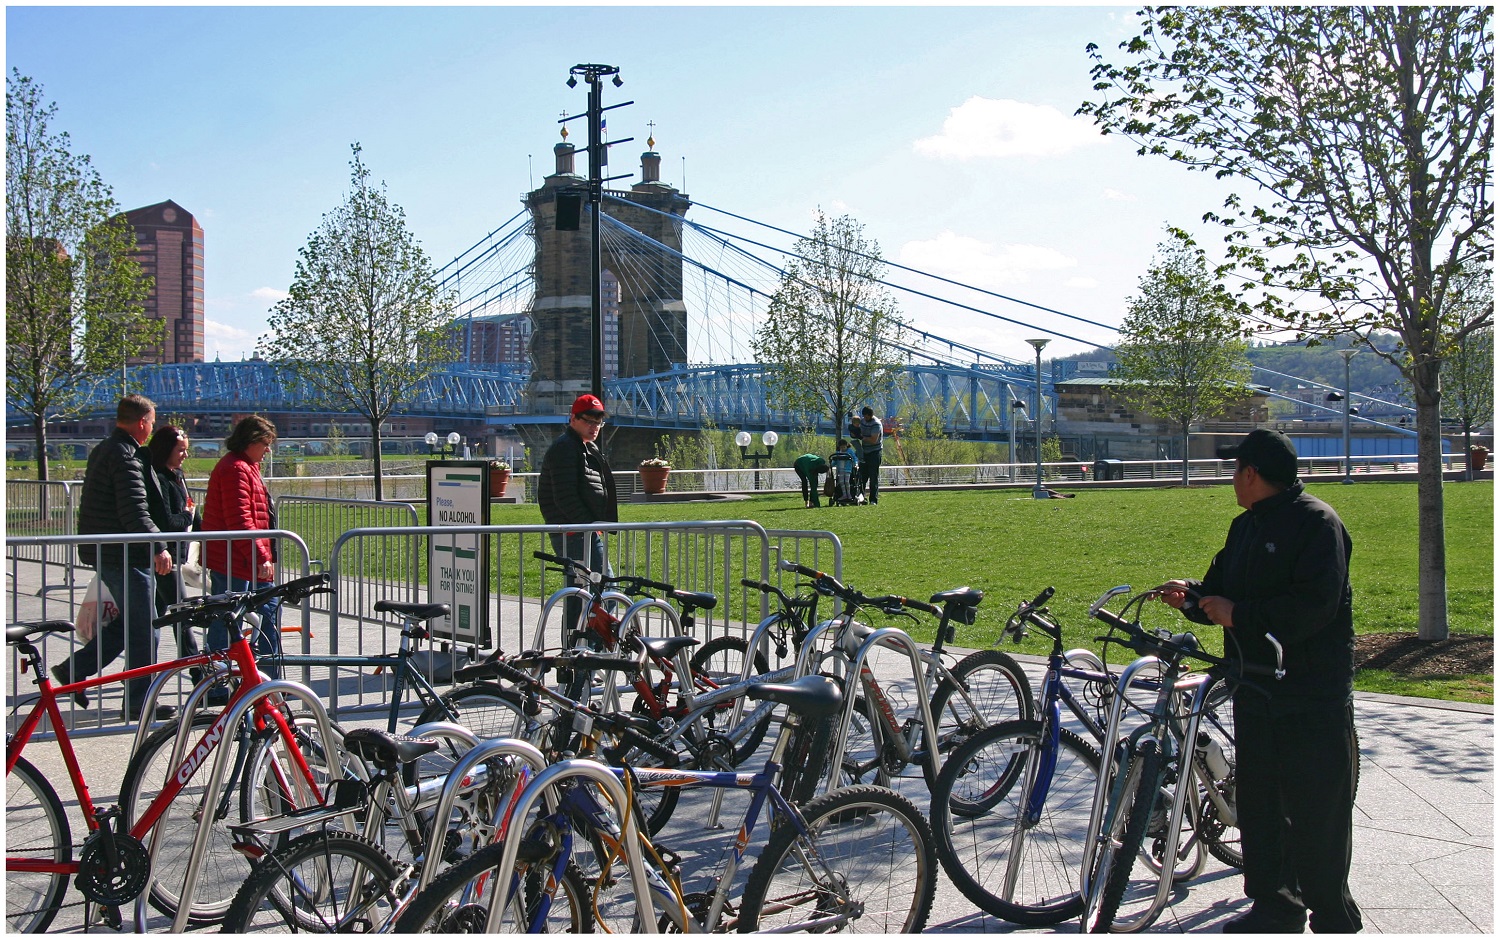
Bicycle Commuter at Moerlein Lager House [Randy Simes]
Research continues to show that Americans are driving less, but are biking, walking and using transit more. This is true in Cincinnati to the extent that transit ridership has increased in recent years.
While originally attributed to the economic downturn at the beginning of the century, these trends have continued while the economy has rebounded – leading many to believe it is an indication of new market forces being driven by aging Baby Boomers and emerging Millennials. Perhaps predictably so, governments have been slow to change with the changing economic forces.
Despite a growing number of trips for biking, walking and transit, funding has not increased correspondingly. In fact, many communities have seen funding for these non-automotive forms of transportation decrease as governments have worked to cut spending at all levels. This, new research finds, is only exacerbating the problem of having underfunded these modes of transportation for many years.
“Conventional statistics tend to under report active travel because most travel surveys under-count shorter trips (those within a traffic analysis zone), off-peak trips, non-work trips, travel by children, and recreational travel,” stated Todd Litman, Executive Director of the Victoria Transport Policy Institute, in a summary of his report entitled Whose Roads? Evaluating Bicyclists’ and Pedestrians’ Right to Use of Public Roadways.
Transportation Mode Share in Cincinnati Region [OKI]
“More comprehensive surveys indicate that active travel is two to four times more common than conventional surveys indicate, so if statistics indicate that only 5% of trips are by active modes, the actual amount is probably 10-20%.”
Litman indicates that funding levels tend to be much lower than even the low 5% trip share estimates, and recommends changing those levels to reflect not only the current trip share levels, but those that could be achieved should investments be made.
Unequal Funding Allocations at Regional Level
At the local level, the same situation of unequal funding allocation exists. In the 2040 Regional Transportation Plan, developed by the OKI Regional Council of Governments, approximately 88% of the nearly $21.5 billion in funding is recommended to go toward roadway projects, just 11% to transit and a mere 0.1% to bicycle and pedestrian improvements.
While the level of investment in transit appears closely aligned with current ridership levels for commute-related trips, it is far below ideal levels for bicycle and pedestrian investments.
“Relatively aggressive pedestrian and cycling improvement programs only cost about 1-4% of the total per capita roadway expenditures, or just 4-10% of general taxes spent on local roadways,” Litman contests. “Since walking and cycling represent about 12% of total trips, and a much larger share of short urban trips, and since most North American communities have under-invested in walking and cycling facilities for the last half-century, much larger investments in walking and cycling facilities can be justified to meet user demands and for fairness sake.”
OKI leadership contends that the organization’s regional planning document does not accurately reflect the level of investment being made in bicycle and pedestrian infrastructure, noting that many of the “roadway projects” in their plan actually include bike and pedestrian elements.
To that end, some recent improvements have been made with regard to bicycle infrastructure. The City of Cincinnati has installed around 40 miles of new on-street bike lanes or paths over the past several years, and has plans to install a total of 290 miles by 2025. The City’s Bicycle Transportation Plan, however, has been plagued by a lack of funding and has been relegated to only moving forward when roadway resurfacing projects emerge.
Not everyone is convinced, however, that enough is being done in terms of the overall investment needed for bike and pedestrian improvements.
Implications for Regional Transit
Of the money being recommended for transit investments, not including operations, approximately 96% is targeted for the contentious Oasis Line – a commuter rail line connecting Cincinnati’s far eastern suburbs with downtown.
Furthermore, the vast majority of OKI’s recommended transit funding is aimed to pay for ongoing operations – not pay for system expansions or improvements.
This grim financial picture for transit gets even worse when considering contributions from state and local governments.
In Kentucky, meanwhile, communities struggle with state law that prohibits any dedicated source of transit funding – thus forcing the Transit Authority of Northern Kentucky (TANK) to go before the state legislature every year seeking money, similar to how Amtrak must annually go before Congress.
Impact on Environmental Justice Populations
These dire funding and political situations have led to Greater Cincinnati taking the title of being the most populated region in North America without any rail transit; while even far less populated regions advance their own regional transit plans.
What makes the figures more troubling is that those most affected by the imbalanced funding appropriations are minority, low-income and disabled populations. While only 6% of the region takes transit, bikes or walks to work each day, that number escalates to 17% for African Americans, 11% for Hispanics and 10% for people with disabilities; while low-income commuters see that number spike to 21%. Quite simply, the lack of funding for non-automotive forms of transportation is most damaging to those who can least afford it.
Bicycle Commuter at Moerlein Lager House [Randy Simes]
The results of this inequality sparked a recent lawsuit by the ACLU of Wisconsin Foundation and Midwest Environmental Advocates filed a complaint against the Wisconsin Department of Transportation over a $2 billion highway interchange project. In MICAH & Black Health Coalition of Wisconsin v. Gottleib, the ACLU states:
“WisDOT explicitly refused to consider transit expansion (or transit in any way) as part of this proposal. This will further widen the already large gap between transit-dependent communities of color and disproportionately white suburban commuters. The ACLU of Wisconsin Foundation was one of the organizations that have complained about the government’s decision-making and reporting process, as well as how the project would exacerbate segregation and disparities in transportation access for low-income people to jobs.”
And while some of these mode shares may seem low, it has been noted by the U.S. National Household Travel Survey that commute trips are the lowest for walking and biking, while personal trips and trips less than one mile are significantly higher for both modes.
“In much of the region where we have large concentrations of EJ populations the sidewalk network is already quite developed, the roadway network is quite developed and available to bicyclists and the transit service is good,” countered Bob Koehler, Deputy Executive Director at OKI. “We do, as a community, need to do a better job at sharing the road and being aware of pedestrians to make these facilities better for all modes.”
Highway Building Frenzy
Even though young people are increasingly either delaying or choosing not to get a driver’s license at all, user fees collected from the gas tax continue to decline, total vehicle miles traveled (VMT) has been decreasing since 2007 and annualized VMT has been decreasing for nearly a decade, the nation and Cincinnati region continue to build new capacity.
Of the roughly $8.3 billion being recommended for roadway projects in OKI’s planning documents, approximately 73% of that is targeted for additional lanes, new facilities or new interchanges, while reconstruction and improvements to existing roadways account for the rest.
I-75 Construction Work at Mitchell Avenue [Jake Mecklenborg]
“Although VMT may be slightly declining in recent years in some parts of the country this may not be a long-term trend. Clearly the region has many needs,” explained Brian Cunningham, Director of Communications at OKI. “This plan addresses the significant existing safety and congestion needs. The plan is updated every four years and will provide an opportunity to revisit the assumptions.”
Litman argues that shifting some of the investment from roadways to bicycle and pedestrian projects due to their proven ability to reduce congestion and improve safety not only for bicyclists and pedestrians, but motorists as well. He also believes that such policy directives empower people by giving them the ability to choose between multiple transportation options for each of their trips.
“It is important to recognize the unique and important roles that active modes [biking and walking] play in an efficient and equitable transportation system, and the various benefits that can result when walking and cycling are improved, including indirect benefits to people who do not currently use those modes,” Litman concluded.
“Just as it would be inefficient to force travelers to walk or bike for trips most efficiently made by motorized modes, it is inefficient and unfair to force travelers to drive for trips most efficiently made by active modes, for example, if children must be chauffeured to local destinations because their communities lack sidewalks, or if people must drive to recreational trails due to inadequate sidewalks and paths near their homes.”
Data from the Cleveland Branch of the Federal Reserve Bank shows that a poor neighborhood’s income growth, while affected by internal factors, is also highly influenced by its surrounding metropolitan area.
Much the same that a poor family in a strong neighborhood is more likely to be lifted up by the rising tide in their neighborhood, it seems that poor areas of cities have the ability to function in the same manner.
The data from the Federal Reserve measures neighborhood growth, or lack thereof, from 1980 to 2008. Several statistics from the report come as a surprise.
First, while the report finds that a neighborhood’s percentage of residents with a high school degree, bachelor’s degree, and its unemployment rate in 1980 all have some correlation with that neighborhood’s chances of having income growth, the statistics are not all that strong.
The difference in bachelor’s degrees between neighborhoods with no income improvement and those with a high degree of income improvement was around 3%. Meanwhile, the unemployment rate was only about 2% lower in high income growth neighborhoods.
But perhaps the most striking evidence, at the local level, is how much population density correlates with a neighborhood’s likeliness to achieve high income growth.
Neighborhoods that had no improvement had, on average, a density of 12,028 people per square mile in 1980, while neighborhoods with high improvement had an average density more than double that of 30,399 people per square mile.
The City of Cincinnati, by comparison, has a population density around 3,810 people per square mile.
By 2008, the change is stark. Neighborhoods that received high income growth increased their educational attainment, population and population density at a much higher rate than what the report classifies as no-improvement neighborhoods.
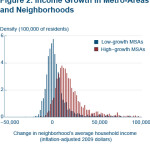
The report also found that poor neighborhoods in low-growth metropolitan statistical areas (MSA) were more likely to remain stagnant or even shrink while poor neighborhoods in high-growth MSAs had a higher chance of experiencing income growth.
While the average income of an MSA in 1980 may not be a good predictor of whether a neighborhood will experience high or low growth, neighborhoods that experienced high income growth were located in regions that experienced higher growth in income, a growing population and increased their population density.
As a result, two identical poor neighborhoods in New York City and Cleveland in 1980 would look much different in 2008, despite being in the same position 38 years prior. The assertion is that a growing metropolitan area has a tendency to lift the tide for all neighborhoods.
The Federal Reserve Bank of Cleveland points out, however, that some of this improvement in high-growth neighborhoods could be due to what they deem residential sorting; basically, changing demographics in the neighborhood.
While the evidence is not certain, the data also shows neighborhoods that experienced high-growth from 1980 to 2008 were also more likely to have gained residents (10%) than low-growth neighborhoods (-20.9%). Therefore, neighborhoods that experienced high growth were those that also had the greatest opportunity for demographic shifts to occur within the neighborhood.
Interestingly enough, while much of the gentrification argument has centered on white residents pushing out minorities, the report found that neighborhoods that experienced high growth rates were more likely to reduce their share of black and white residents, while increasing their share of Hispanic residents.
With this strong evidence indicating population density is linked to a poor neighborhood’s ability to improve, it only reinforces the growing narrative about the suburbanization of poverty in America.
Still, however, there is a long way to go before this narrative is fully realized locally; as it is estimated that roughly half of all children in the City of Cincinnati live in poverty – a number that does not appear to be changing.
While policy makers at City Hall will surely be discussing youth jobs programs, career training, early childhood education and neighborhood health centers, one other item on the policy agenda should be the urban form of our region’s neighborhoods.
We do not know whether higher population densities were a cause or merely correlated with a neighborhood’s ability to improve, but we do know, thanks to this data from the Federal Reserve, that the two issues appear to be more connected than what we may have previously thought.