Categories
Business News

While Limited in Size, Individuals With Limited English Capabilities Perform Well in Regional Economy

In the United States, more than 45 million working-age adults – over 20% – speak a language other than English in their homes.

According to a report released by the Brookings Institute, approximately 19.2 million (almost 10%) of this sub-population are considered “limited English proficient” (LEP). More than 70% of these LEPs participate in the work force, and the Brookings Institute found that they make considerably less (anywhere from 17-135%) than their English-proficient counterparts. These individuals, researchers found, are also more likely to suffer from unemployment and poverty.

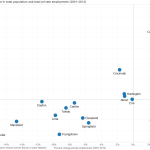
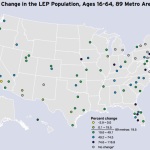
While most LEP individuals live in the nation’s large metropolitan areas, like Cincinnati, their numbers are rapidly growing in smaller urbanized regions, like Dayton and Lexington.

In the Cincinnati metropolitan region, the number of LEP adults exceeds 35,000 and has grown 55.1% since 2000. This places the region in the top 25 of the 89 largest metropolitan areas in the nation; however, LEP individuals only make up 2.5% of the metropolitan region’s total workforce. This places Cincinnati 88th out of the 89 largest regions in America.

There has been a growing interest in this topic recently, with some organizations going as far to organize workshops to help non-native English speakers with business start-up and management training.

Perhaps unsurprisingly, the report found that the most commonly spoken language by LEP individuals is Spanish. Across the nation, that percentage is 66.3%, but represents just 41.9% of the LEP population locally.

The Cincinnati region does, however, have a relatively high percentage of Asian and Pacific Island language LEP workers (35.2%), with Chinese, Vietnamese, and Japanese following Spanish as the top languages spoken. French speakers come in next at 3.9%.

It should be emphasized that while Germans represent the region’s predominant historical migrant community, the German language did not rank amongst the top five languages spoken within Cincinnati’s LEP community. This, however, may be the result of Germans immigrating to the region several generations ago. It also speaks to the complexity of the issue of immigration and the need for a comprehensive study of the matter.

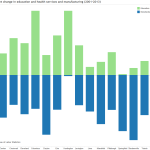
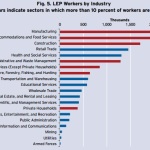
Following national trends, the Brookings Institute found that LEP workers in Cincinnati are most likely to work in industries like manufacturing, accommodation and food service. Cincinnati’s LEP workers, however, were found to be slightly more educated than the national average, with a smaller percentage of individuals with less than a high school education and a larger percentage of individuals with an education level of at least some college or a bachelor’s degree or higher.

Those positive numbers seem to translate into better economic performance for the region, with more than 76% of Cincinnati’s LEP workers active in the regional workforce – a rate that is slightly better than the national average.

With demographers predicting that almost all growth in the U.S. labor force will come from immigrants and their children over the next half-century, these statistics have a large impact on the overall well-being of the American economy.

EDITORIAL NOTE: Listen to our podcast with Alfonso Cornejo, President of the Cincinnati Hispanic Chamber, and Kristin Hoffman, an Immigration/Administration Lawyer with Hammond Law Group, to learn more about the region’s efforts and needs to become more welcoming to immigrants and foreign language speakers.

Categories
News Opinion Transportation

Transit Users Will Need 7 Hours to Commute to ODOT Public Transit Meeting

An event making the rounds on social media hosted by the Ohio Department of Transportation (ODOT) provides an opportunity for citizens to tell Governor John Kasich’s (R) administration about public transportation improvements they’d like to see in their city. The public meeting to discuss statewide transit needs is hosted on Friday, October 31 from 10am to 12pm at the Warren County OhioMeansJobs Center in Lebanon.

While the gathering has good intention, it fails to meet the basic criteria of planning a public involvement meeting:

  1. Never host a public meeting on a holiday.
  2. Never host a public meeting on a Friday or weekend.
  3. The location of a public meeting should be accessible to all members of the community and able to attract a diverse group of citizens.

By car, Lebanon is roughly a one hour drive north of Cincinnati, and a 30-minute drive south from Dayton. It’s also the city where the regional ODOT office is located; understandably why the administration would opt to hold a public involvement meeting here. What went unconsidered are the needs of people that the public meeting is focused on: citizens reliant on public transportation.

The closest Metro bus stop to Lebanon is 8.3 miles away, near Kings Island in Mason. Let’s say we’re feeling ambitious and attempt to take the bus, then bicycle the remaining journey to Lebanon. It would take 48 minutes to cycle to the meeting in addition to the 1 hour, 11 minute ride on the bus. Cincinnati Metro, the region’s bus system, only offers select service to the northern suburbs. In order to arrive on time for the 10am meeting, a person dependent on transit would have to catch the 71x at 7:45am, arrive in Mason at 8:52am, then continue to the meeting on bicycle.

Getting back home is another story. The public involvement meeting adjourns at 12pm, but the bus route that services Mason is a job connection bus, meaning it only runs traditional hours when people are going to and from work. After another 48 minutes of cycling back to the bus stop, the inbound 71x picks up shortly after 3pm and returns to Cincinnati at 4:40pm.

In summary, if a citizen dependent on bus transportation wishes to give ODOT their input, they would spend 7 hours commuting to the two hour meeting, and need to able-bodied to ride a bicycle for eight miles. What about senior citizens and people with disabilities? Who can afford to take an entire day off work to attend a meeting? As a transit rider who has a car, driving an hour each way to attend the meeting –in the middle of the work day– for me, is inconvenient and unfeasible.

The poor choice of trying to combine Cincinnati and Dayton into one meeting was an unfortunate oversight in event planning. Instead, meetings should be hosted in the downtown of each city, just like they have been in Columbus and Cleveland which are also participating in the ODOT series.

Since 2011, Governor Kasich has cut $4 million from the state’s public transit budget, leaving Ohio with one of the lowest funded transit systems in the country. If there’s a genuine interest in hearing how those cuts affect the people that rely on public transportation the most, the administration needs to schedule a second meeting in Cincinnati near Government Square where those people can actually get to.

Of course, this isn’t the first time area transit users have been ignored when it comes to public meeting locations. Earlier this year, Ohio Secretary of State Jon Husted (R) upheld a decision to relocate Hamilton County’s Board of Elections office to a location that would take up to four hours to access by transit.

Categories
Business News

Federal Reserve Data Reveals Cincinnati Economy is Out-Performing Regionally, Lagging Nationally

New data from the Federal Reserve Bank of Cleveland, which covers Ohio, western Pennsylvania, the West Virginia panhandle, and the eastern half of Kentucky, provides a glimpse into the recovery and transition of the region’s economy.

According to the newly released data, spanning from 2001 to 2012, this Federal Reserve region has weathered an incredibly tumultuous 11 years.

“Historically, much of the region has specialized in manufacturing, a sector that has been particularly hard hit over the past few decades,” noted Federal Reserve Bank of Cleveland research analyst Matthew Klesta in his data brief. “Since the end of the Great Recession in 2009, however, the decline in manufacturing employment has slowed. In some places, employment has even grown.”

Since the first year of recorded information in this data set, all 17 Metropolitan Statistical Areas (MSA) in the region, with the exception of Wheeling, WV, saw losses in manufacturing employment – the region’s historical economic stalwart. MSAs like Dayton and Steubenville posted losses of almost 50%. Cincinnati, meanwhile, saw its manufacturing sector decline by nearly 25% – a mark that is low by regional standards.

International trends in trade in the early 2000s, like China’s entry into the WTO and the increase of offshoring from developed to developing nations, combined with the Great Recession, dealt a critical blow to the area’s manufacturing sector. Excluding education and health services, every other industry in the region saw significant jumps in the annual percentage of jobs being lost during the Great Recession.

For example, between 2001 and 2007 the average loss per annum for the manufacturing sector was a little less than 3%; but from 2008-2009 it jumped to nearly 7%. Since the Great Recession, however, many MSAs in the area have posted modest gains in manufacturing employment, while still falling well below baseline levels in 2001.

While the manufacturing sector has declined throughout this Federal Reserve region, health and education sectors have grown. Despite a nationwide average of 1.2 health and education service jobs gained per 1 manufacturing job lost, only four MSAs in the region (Cincinnati, Columbus, Huntington, Pittsburgh) can boast an overall replacement of lost manufacturing jobs with health and education employment.

The replacement of manufacturing jobs with health and education employment does not bode well for the region’s workers. According to the data, the health and education sectors pay, on average ($44,000 in 2012), significantly less than manufacturing ($55,000 in 2012).

But while this changing economic landscape has meant a smaller presence for manufacturing in the region, this Federal Reserve Bank region continues to be highly specialized in that economic sector. Perhaps as a result, population loss continues to plague many MSAs within the region.

From 2001-2011, while the national population grew by 10% the regional population posted an average gain of only 1.6%. In fact, only five (Cincinnati, Huntington, Akron, Columbus, Lexington) of the 17 MSAs in the region saw their population rise over that time period. Of those five metropolitan areas, only two (Lexington and Columbus) posted gains in both population and private-sector employment.

Pittsburgh and Wheeling, meanwhile, managed to post positive gains in private-sector employment while still shedding population. The remaining 10 MSAs all posted losses in private-sector employment and population.

Categories
Business Development News Opinion

EDITORIAL: It’s Time for Cincinnati to Build a New First-Class Arena

The Cincinnati region has an arena problem that is two-fold. The first part of the problem is that there is no stand-out venue that offers both the capacity and modern amenities to attract large-scale events. The second is that the region has far too many venues competing with one another.

Within a one-hour drive from Fountain Square there are eight arenas with a capacity of more than 9,000 people for their primary tenants. Of these, only three have been built or undergone major renovations since the year 2000. The lone major project currently on the books is the $310 million renovation and rebuild of Rupp Arena in Lexington, which also happens to be the furthest away of the eight venues mentioned.

  1. Rupp Arena (23,500): Built in 1975 with minor renovations in 2001. Primary tenant is University of Kentucky athletics. Major renovation and rebuild planned for completion in 2017.
  2. U.S. Bank Arena (17,566): Built in 1975 with a major renovation in 1997 and subsequent minor renovations. Primary tenant is the minor league hockey Cincinnati Cyclones team.
  3. UD Arena (13,409): Built in 1969 with major renovations in 2002 and minor renovations again in 2010. Primary tenant is University of Dayton athletics.
  4. Fifth Third Arena (13,176): Built in 1989 with several minor renovations since. Primary tenant is University of Cincinnati athletics.
  5. Cintas Center (10,250): Built in 2000. Primary tenant is Xavier University athletics.
  6. Cincinnati Gardens (10,208): Built in 1949 with no major renovations since its opening. Primary tenant is the amateur women’s roller derby Cincinnati Rollergirls team.
  7. Bank of Kentucky Center (9,400): Built in 2008. Primary tenant is Northern Kentucky University athletics.
  8. Millett Hall (9,200): Built in 1968 with no major renovations since its opening. Primary tenant is Miami University athletics (sans hockey).

Recent talks closer to the core of our region have revolved around either embarking on a major renovation of Fifth Third Arena, or building a new one altogether; and performing major renovations on U.S. Bank Arena. The problem with these two approaches, however, fails to address the two core problems with the region’s plethora of arenas.

Any discussion on this topic should be focused on creating a stand-out venue that is both large enough and offers the modern amenities needed to attract major events, while also decluttering the regional arena landscape.

To that end, UrbanCincy recommends building a brand new arena adjacent to the Horseshoe Casino at Broadway Commons that would become the new home for the Cincinnati Cyclones, Cincinnati Rollergirls and University of Cincinnati Men’s Basketball. This venue would also accommodate the existing events held at U.S. Bank Arena and should be built in a way that is conducive for casino operators to program additional events, such as boxing, at the venue.

As part of this plan, U.S. Bank Arena and the Cincinnati Gardens should be torn down, and Fifth Third Arena used as the multipurpose facility it was originally intended to be.

This location makes perfect sense with immediate access to the center city’s hotels and convention facilities, casino, streetcar system, highways and abundant parking. Such a plan would also allow for the current U.S. Bank Arena site to be redeveloped with additional housing and shops akin to what is being developed at The Banks.

The land left over at the Cincinnati Gardens site in Bond Hill could then be repackaged, with surrounding land, to be developed as part of community-driven master plan.

As is often the case, funding is one of the primary hurdles preventing any of this from getting done. In this particular plan, each of the partners (University of Cincinnati, City of Cincinnati, Hamilton County, Horseshoe Casino) could contribute to the capital costs. Furthermore, value capture tools could be used for the U.S. Bank Arena and Cincinnati Gardens properties to help offset costs even more.

The last thing our region needs is another tax to pay for a sports or entertainment complex. Those scarce public resources should be reserved for more pressing things like improving our region’s transit network.

Our region’s political and business leaders need to think holistically when it comes to this challenge. Moving forward in a panicked and rushed fashion will get us an end result that does not solve the problems before us, and ultimately squanders public dollars.

Let’s build ourselves a modern arena venue that can attract top-level events, but do so without placing the burden on the taxpayers. Let’s also do so in a way that rids the region of some of its excess number of existing arenas, and frees up land to be redeveloped in a more productive manner for our neighborhoods.

There is a wealth of talent and C-Level executives in this region. Let’s get creative and start thinking beyond the sales tax. Let’s get this done.

Categories
Business Development News

Cincinnati Posts Population Gain for Second Consecutive Year

Cincinnati has added about 1,000 new people since the decennial census in 2010, according to new estimates released by the U.S. Census Bureau.

The modest increase comes from two consecutive years of population gains that followed an immediate downward revision after the 2010 Census. The increase also means that just Cincinnati, Columbus and Dayton were the only big cities (more than 50,000 people) in Ohio to post gains.

Columbus and Cincinnati, meanwhile, were the only big cities to post population gains for the past two years.

The population estimates are derived using the 2010 Census as a baseline and then factoring in new permitted residential construction and mobile homes, and subtracting out the estimated number of homes lost each year. As a result, all of the annual estimates should come with a grain of salt.

Ohio Cities Comparison

With that said, Dayton’s population gains appear to be an anomaly, while the increases in Columbus and Cincinnati appear to be more rooted. In any case, the news for Ohio’s big cities is not good as the rest all lost population, especially those in the northeastern part of the state.

Columbus continues to stand out from the rest of Ohio’s big cities in terms of its population trends. In this latest estimate release, Columbus posted the fifteenth largest numeric population gain of any municipality in America; and it comes on the heels of equally impressive gains in prior years.

Some observers, however, would attribute some of the gains in Columbus to its unusually large municipal boundaries that include what would be far suburbs in other Ohio regions.

While Columbus has been growing by about 1.5% annually over the past several years, Cincinnati has been growing annually by about 0.25%.

When compared with other peer cities, Cincinnati’s gains look even more tepid.

Peer Cities Comparison

Of fifteen other cities competitive with Cincinnati, the city bested only five of them in terms of population growth, while being significantly outperformed by most all others. In this comparison, even Ohio’s best performer – Columbus –fares only reasonably well against the field.

For Cincinnati’s peer cities, national trends appear to hold true. Southern cities continue to grow at the fastest clip, but their growth rates are leveling off. In our comparison, Austin, Atlanta and Tampa have all experienced significant declines in annual population growth since the 2010 Census. Charlotte has also experienced a similar trend, but appears to be holding steady more so than its Sun Belt peers.

Meanwhile, while many Midwestern cities continue to lose population, they are doing so at a slower rate or have stopped the losses entirely.

As we previously examined on UrbanCincy, the Cincinnati region continues to grow by about 0.4% annually. The City of Cincinnati’s 2013 gain represents approximately 12.5% of the total regional population growth, and half of Hamilton County’s increase last year.

In a nutshell, Cincinnati is over performing regionally, but under performing amongst its peers. If Cincinnati were growing as fast as Charlotte or Austin, the city would be adding around 9,000 new people every year.