Categories
Development News

Nationwide Housing Shortage Most Dire For Those at the Bottom

For those at the lowest rungs of America’s economic classes, the affordable housing crisis is bad and getting worse. According to a 2011-2013 study released in 2015 from the Urban Institute, not a single county in the United States has an adequate supply of affordable housing for those in extreme poverty. Families classified as extremely low-income (ELI), or those making less than 30 percent of an area’s median household income, have far less options today than in 2000. On average nationally, only 28 affordable units are available for every 100 ELI renter households. That represents a 25% decrease in the years since 2000, when there were 37 affordable units for every 100 ELI households.

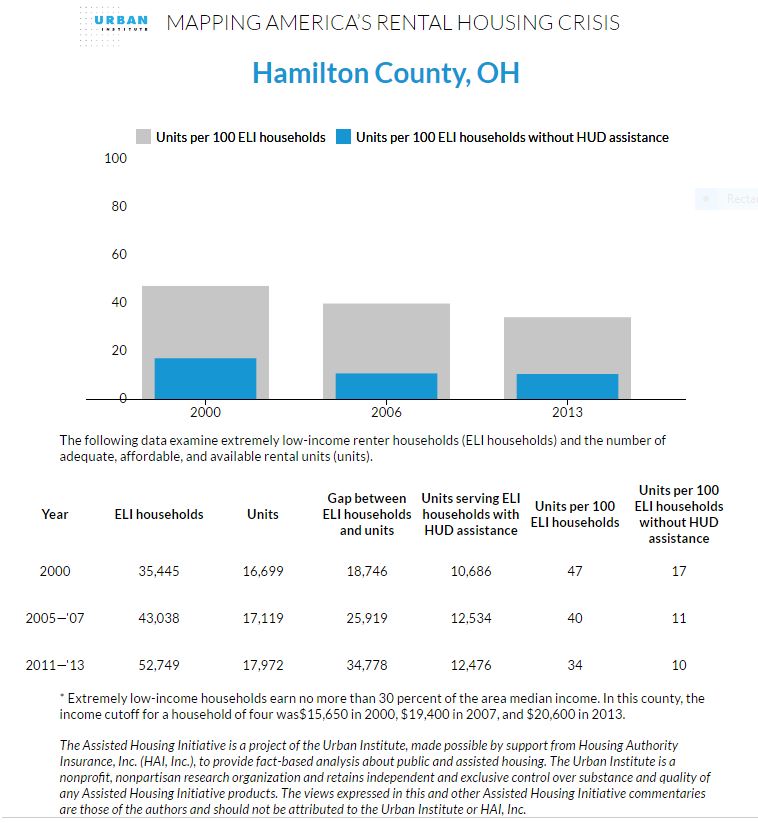
In Hamilton County, there are 52,749 ELI households (making $20,600 or less), with only 17,972 affordable units. This amounts to around 34 affordable and adequate units for every 100 households. In 2000, there were 47 units for every 100 ELI renter households. As usual, most of Cincinnati’s peer cities are facing a similar situation for their region’s poorest residents. In Cuyahoga County (Cleveland), there exist only 31 affordable units out of 100 families today, compared with 44 in 2000. In Allegheny County (Pittsburgh), there are 35 units per 100 families today while there were 44 per 100 in 2000.

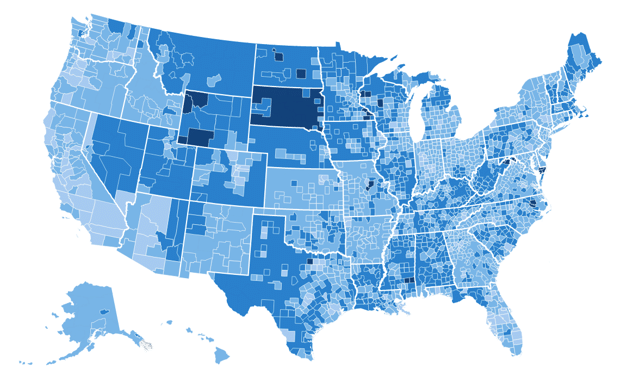
Since 2000, many rural and suburban counties have joined metropolitan counties in their extremely low numbers of available units per needy households. The change is visibly stark on the Infographic for the State of Ohio, As the Urban Institute notes, the most drastic changes have occurred in the Midwest, South, and West in states like Ohio, Kentucky, Alabama, and Nevada, where comparatively abundant ELI housing availability in 2000 has plummeted.

The last 16 years have also seen ELI families increasingly reliant upon federal assistance for housing. The Great Recession, rising prices in many metropolitan areas, stagnant wages, and lack of development mean that while only 57% of families relied on HUD in 2000, more than 80% do now.

Indeed, while the Urban Institute points out that federal assistance for housing has grown (albeit not enough), they also acknowledge that many in the US Congress frequently call for cuts to federal housing assistance provided through the Department of Housing and Urban Development (HUD). Without this federal assistance, an already-dire situation for ELI families becomes catastrophic. Accounting for a theoretical total cut in federal housing assistance, there would exist only 5 affordable units for every 100 ELI renter household. That amounts to a mere 609,802 units for 11,341,484 ELI households. In Hamilton County specifically, there would be only 10 units for every 100 households. Cuyahoga and Allegheny Counties fair even worse, with only 5 and 3 units per 100 ELI renter households, respectively.

While the nationwide housing crisis has been much-discussed, including on this site, the true scope of the problem is most visible at the bottom of the economic spectrum. The biggest loss in affordable housing for extremely low income families has occurred mostly in unassisted units, highlighting the need for more affordable developments nationwide. Without increased federal assistance, along with more and smarter development across the nation, many will be driven to homelessness and unsafe & overcrowded housing.

Categories
Business News

Cincinnati Fares Poorly When Examining Centralization of Jobs Throughout Region

A December 2014 Salon article, using statistics from an April, 2013 Brookings Institute report shed light on an increasingly-present paradox in the American economy – America’s next generation of workers prefers urban living, but jobs tend to be decentralized and located far from most region’s urban center.

The report found that from 2000 to 2007 the share of jobs located within two miles of a major urban area’s central business district declined 2%; and that by 2010, a nationwide average of 43% of jobs were located at least 10 miles from the CBD. Only 24% of jobs, meanwhile, were located within two miles of most regions’ primary downtown.

The pattern is more acute in Cincinnati than in most other metropolitan areas, where a robust urban turnaround has been taking place. Compared to the national average of 22.9%, only 17.7% of the region’s jobs were located within three miles of the CBD, which in Cincinnati’s case would also include Uptown. Furthermore, 52.8% of the region’s jobs, approximately 452,000, lie between 10 and 35 miles from downtown.

In the first decade of the new century, which was defined nationally by the huge job losses of the Great Recession, the Cincinnati region lost a total of 76,845 jobs. Of those, 67,122 were within 10 miles of the CBD. While total jobs declined 8.2%, the jobs within 10 to 35 miles of downtown Cincinnati increased 3.3%, with both other areas experiencing declines.

While these recent gains tend to buck the national trend, the Cincinnati region’s employment remains more sprawled than the average American metropolitan area. But while the region has fewer jobs than average within 10 miles its CBD, the Cincinnati region has more jobs within 10 to 35 miles than all but three Midwestern regions (Detroit – 77.4%, Chicago – 67.4%, St. Louis – 62.1%). Columbus and Cleveland come in at 35.4% and 46.5%, respectively.

What this seems to indicate is that Cincinnati has a lower reliance on jobs from manufacturing and agricultural industries than most of its Midwestern peers.

The Brookings Institute went on to find that the Great Recession stalled this trend across the board, as hard-hit industries like manufacturing and retail tend to be the most decentralized. Yet, from 2000 to 2010, 91 of the largest metropolitan areas in the nation saw the number of jobs within three miles of their CBD decline.

Washington, DC, which serves as a national economic outlier for its massive job and wage growth, was the only metropolitan area that saw downtown jobs rise as both a percentage and gross number.

Researchers say that the land-use and zoning policies of each metropolitan area affect the geographical characteristics of jobs within that area. While metropolitan areas with over 500,000 jobs tend to be more decentralized, large metropolitan regions like Chicago, Atlanta or Detroit include large secondary clusters of employment outside of their traditional downtown.

While talented young workers increasingly show their preference for walkable urban communities, jobs continue to decentralize throughout the United States. This distribution creates problems for the region in terms of building and maintaining infrastructure. It also does not bode well for more sprawled regions, like Cincinnati, in terms of being able to attract a new workforce to take the place of aging Baby Boomers.

Categories
Business News

Federal Reserve Data Reveals Cincinnati Economy is Out-Performing Regionally, Lagging Nationally

New data from the Federal Reserve Bank of Cleveland, which covers Ohio, western Pennsylvania, the West Virginia panhandle, and the eastern half of Kentucky, provides a glimpse into the recovery and transition of the region’s economy.

According to the newly released data, spanning from 2001 to 2012, this Federal Reserve region has weathered an incredibly tumultuous 11 years.

“Historically, much of the region has specialized in manufacturing, a sector that has been particularly hard hit over the past few decades,” noted Federal Reserve Bank of Cleveland research analyst Matthew Klesta in his data brief. “Since the end of the Great Recession in 2009, however, the decline in manufacturing employment has slowed. In some places, employment has even grown.”

Since the first year of recorded information in this data set, all 17 Metropolitan Statistical Areas (MSA) in the region, with the exception of Wheeling, WV, saw losses in manufacturing employment – the region’s historical economic stalwart. MSAs like Dayton and Steubenville posted losses of almost 50%. Cincinnati, meanwhile, saw its manufacturing sector decline by nearly 25% – a mark that is low by regional standards.

International trends in trade in the early 2000s, like China’s entry into the WTO and the increase of offshoring from developed to developing nations, combined with the Great Recession, dealt a critical blow to the area’s manufacturing sector. Excluding education and health services, every other industry in the region saw significant jumps in the annual percentage of jobs being lost during the Great Recession.

For example, between 2001 and 2007 the average loss per annum for the manufacturing sector was a little less than 3%; but from 2008-2009 it jumped to nearly 7%. Since the Great Recession, however, many MSAs in the area have posted modest gains in manufacturing employment, while still falling well below baseline levels in 2001.

While the manufacturing sector has declined throughout this Federal Reserve region, health and education sectors have grown. Despite a nationwide average of 1.2 health and education service jobs gained per 1 manufacturing job lost, only four MSAs in the region (Cincinnati, Columbus, Huntington, Pittsburgh) can boast an overall replacement of lost manufacturing jobs with health and education employment.

The replacement of manufacturing jobs with health and education employment does not bode well for the region’s workers. According to the data, the health and education sectors pay, on average ($44,000 in 2012), significantly less than manufacturing ($55,000 in 2012).

But while this changing economic landscape has meant a smaller presence for manufacturing in the region, this Federal Reserve Bank region continues to be highly specialized in that economic sector. Perhaps as a result, population loss continues to plague many MSAs within the region.

From 2001-2011, while the national population grew by 10% the regional population posted an average gain of only 1.6%. In fact, only five (Cincinnati, Huntington, Akron, Columbus, Lexington) of the 17 MSAs in the region saw their population rise over that time period. Of those five metropolitan areas, only two (Lexington and Columbus) posted gains in both population and private-sector employment.

Pittsburgh and Wheeling, meanwhile, managed to post positive gains in private-sector employment while still shedding population. The remaining 10 MSAs all posted losses in private-sector employment and population.