Categories
Business News

The Location of Every Job in Cincinnati Mapped

Ohio Employment Dot Map

Two years ago, University of Virginia researcher Dustin Cable put together a detailed dot map based on the racial distribution of people in the United States. This work inspired another researcher to put together something similar, but for America’s job distribution.

Robert Manduca studies sociology and social policy at Harvard University. He says that while jobs and the economy are continuously discussed, we seem to know very little about where jobs are actually located. So what he did was examine the Census Bureau’s Longitudinal Employer-Household Dynamics data and then plot that information out on an interactive map.

The LEHD data is based on state unemployment insurance records, and tabulates the count of jobs by census block,” Manduca explained on his website. “Here, jobs are colored by type, allowing us to see how different industries and sectors exhibit different spatial patterns–some clustering in downtowns, others spreading across city and suburbs alike.”

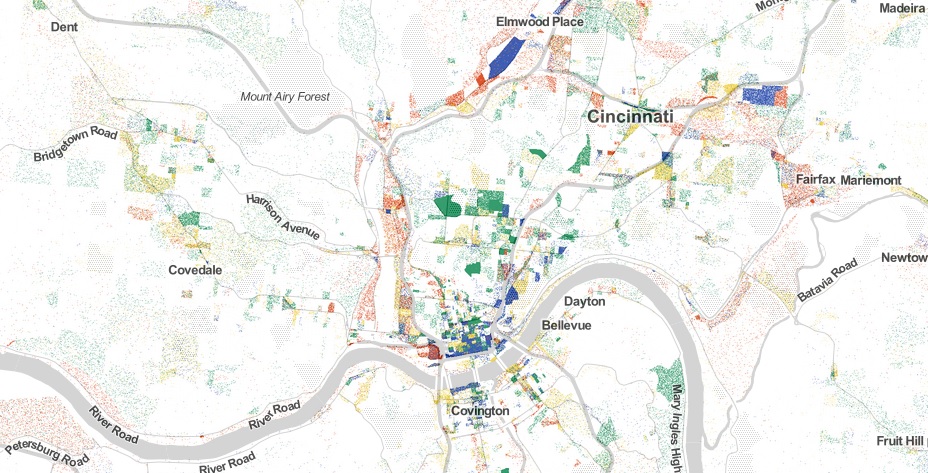
The way the visualization works is that red represents Manufacturing & Trade; blue for Professional Services; green for Healthcare, Education and Government; and yellow for Retail, Hospitality and Other Services.

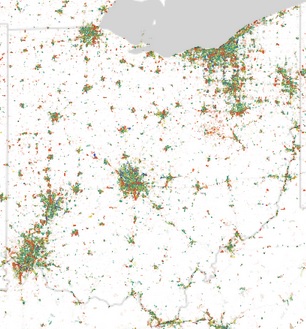
Upon examination of the map, you can see that some cities and regions have a much stronger concentration of jobs than others. When looking at Ohio from a distance, it looks like this pattern holds true for the state’s three big cities. That picture changes as a more detailed look is taken at Manduca’s research.

In Cincinnati, for example, the two largest job centers, downtown and uptown, are joined by the Mill Creek Valley and Blue Ash as areas with heavy concentrations of jobs. As expected, there is a large cluster of education and health jobs uptown, while downtown boasts the region’s heaviest concentration of professional service jobs.

Blue Ash then comes in as, perhaps, the most impressive job center for professional service jobs in the region outside of the center city.

The Mill Creek Valley, which generally runs north along I-75 from the Ohio River, serves as the region’s primary manufacturing and trade corridor. This industrial corridor is well-rooted in Cincinnati’s history, and is even reflected in the City of Cincinnati’s robust tax collections from these zip codes.

The research reveals how much of a barrier the natural landscape serves as when considering job distribution. Throughout the Cincinnati region, for example, you can see how the hills cut across the landscape.

The data also shows that while Cincinnati is often defined by an east/west divide, the distribution of jobs is far more north/south oriented than it is east/west. Of course, the same is true for the region’s population.

Categories
News Politics Transportation

Stars Aligning for Cincinnati to Chicago High-Speed Rail

4123288130_f7b778d9d5_bLocal and national developments show positive signs for America’s oft-criticized national passenger railroad company, Amtrak. A railroad reform bill introduced in the Senate contains many positive changes for Amtrak and local support continues to grow for increased service on Cincinnati’s tri-weekly train to Indianapolis and Chicago.

The Railroad Reform, Enhancement, and Efficiency Act of 2015 (RREEA, S.1626) was introduced by Senators Cory Booker (D-NJ) and Roger Wicker (R-MS) to improve Amtrak service across the nation. The bill addresses several different issues for the railroad, including expansion, funding, and leadership. It also provides an increase in funding levels for the railroad through 2019.

In terms of leadership, the legislation would reorganize the board of directors for the railroad, with two representatives for the heavily traveled Northeast Corridor, two for long-distance routes (the Cardinal), and two for state-supported lines. There would also be one “floating” member.

The RREEA also includes several sections that fuel possible future expansion of the national rail network by establishing a committee to facilitate communication and cooperation between states and Amtrak on state-supported routes. In addition, it would require Amtrak to work with an independent agency to evaluate all routes and review possible elimination of routes, expansion or extension of current routes, or the establishment of new ones.

While calling this clause problematic, the National Association of Railroad Passengers acknowledges that this text includes a “comprehensive framework for analyzing a route that recognize the unique benefits rail service provides.”

Section 301 of the act explicitly requires that the Department of Transportation set up a program to assist the operating costs of launching or restoring passenger rail transportation. The section seems to be a nod towards the amount of routes cut from the system over Amtrak’s 40-plus years of operation.

Additional clauses provide mechanisms for cooperation between states and the federal government, when it comes to addressing the backlog of capital projects within the system, Amtrak’s money-losing food service, and the restoration of service along the Gulf Coast, a line that has been out of commission since Hurricane Katrina in 2005.

After the deadly derailment in Philadelphia in May, safety across the network is a major component of this legislation.

Both sponsoring senators touted the bipartisan nature of the bill and Senator Wicker’s office released a statement identifying the national passenger rail system as an “integral part of our overall transportation structure and our economy,” and thanking Senator Booker for his support and help in creating the bill.

The Senate Committee on Commerce, Science, & Transportation voted on July 13 to include the RREEA Act into the broader transportation bill, the Comprehensive Transportation and Consumer Protection Act of 2015 (S.1732).

In the Cincinnati metropolitan area, support continues to grow for the expansion of rail service in the area, especially to Chicago.

The City of Hamilton recently applied to Amtrak for a stop and has passed a resolution of support for increased service. Nearby in Oxford, home of Miami University, initial approvals have been set to create a station for Amtrak, and efforts are currently underway to identify the exact location for that facility.

The effort has also gained support from the University of Cincinnati Student Senate, when they passed a resolution 31-1 in support of increased rail service to Chicago, citing Chicago as “an important transportation hub for students’ co-op travels, as well as an economic destination for students, staff, and faculty alike.”

According to All Aboard Ohio’s Southwest regional director, Derek Bauman, the UC student government president is also coordinating with other local university student governments to obtain resolutions of support; and in addition to Hamilton, both Norwood, where Amtrak employs local workers, and Wyoming, where the Cardinal line runs through, have also passed resolutions of support for increased passenger rail service.

Hamilton County commissioners also unanimously approved a resolution pursuing a feasibility study.

Going forward, Bauman says that there will be a need for increased cooperation and support from local Metropolitan Planning Organizations along the route. In Columbus, the Mid-Ohio Regional Planning Commission (MORPC) has actively supported the implementation of a Columbus-Ft. Wayne-Chicago rail line; and in Northeast Ohio, a consortium of local MPOs have banded together and formed a sub-group to support increased rail service to the region.

From here, leadership at All Aboard Ohio says that they hope the OKI Regional Council of Governments will take a similar approach on behalf of the Cincinnati region.

Categories
News Transportation

Cincy Red Bike On Pace to Shatter First Year Ridership Projections

Community leaders gathered in Covington yesterday to celebrate the opening of the first six of 11 new Cincy Red Bike stations in Northern Kentucky. Four additional stations will be opened in Newport, and one in Bellevue, by the end of the week.

The expansion south of the river is a natural expansion for the system, which has thus far focused on Cincinnati’s center city neighborhoods. After initially launching with 30 stations in Downtown, Over-the-Rhine, Clifton Heights, University Heights, Clifton, Corryville and Avondale, Cincy Red Bike has now added new stations in the West End and Northside.

Perhaps more critical for the system’s ridership, however, is the fact that many of the newer stations in Ohio are what operators call “infill” stations. For these, Jason Barron, Cincy Red Bike Executive Director, says that they are looking at locations that focus less on landmarks, and more on where people live car-light or car-free.

“The three busiest stations, by a factor of a third, are Fountain Square, 12th/Vine and Main/Orchard,” Barron previously told UrbanCincy. “We will start to look at areas in the West End like Linn Street, Bank Street, City West and maybe Brighton. We have to look and see where there are opportunities to connect people and make a difference in their lives.”

Once the remaining installations are complete, Red Bike will boast 50 stations, making it the largest bike-share operator in Ohio and the first in all of Kentucky. CoGo Bike Share in Columbus is the second largest with 41 stations following a recent expansion of their own.

After a predictably sluggish winter, it now appears that Cincy Red Bike is on pace to at the very least meet, and most likely exceed, its first year ridership projections. When the system launched in September 2014 the hope was to attract 52,000 rides within the first year. As of now, some 46,000 rides have been made on the public bike-share system.

With the system average 4,600 rides per month, including the slow winter months, the initial projection will be easily surpassed. If that monthly ridership rate increases over the forthcoming summer months, and with the added stations and bikes, the non-profit agency may be able to significantly exceed its own goals.

The enthusiasm in Northern Kentucky appears to be setting the table for even more expansions in the Bluegrass State in the near future. Already, funding is being lined up for an additional station in Bellevue, and the president of Southbank Partners told River City News that they hope to see Red Bike added to Dayton, Ft. Thomas and Ludlow as well.

In addition to Northern Kentucky, additional infill stations are anticipated uptown and neighborhood leaders continue to call for the system’s expansion to the Walnut Hills area.

Red Bikes can be used by purchasing an $8 pass that is good for unlimited rides of 60 minutes or less over a 24-hour period. Those who plan on using the system more than 10 times per year are better off purchasing an annual membership for $80.

Categories
Development News

Columbus is not the biggest city in Ohio, and Indy’s not bigger than Boston

Following the release of the U.S. Census Bureau’s updated population numbers for American cities, much has been made about the urban rise of the west. Even the Census Bureau itself touted the growing number of cities with more than 1 million people – the vast majority of which are located west of the Mississippi River.

These numbers can be misleading, and often don’t even pass the smell test.

Is Jacksonville, for example, really a bigger city than Detroit, Washington DC, Atlanta and Boston? Or out west, would most people actually consider Phoenix to be a larger city than San Francisco, Seattle, Denver or San Diego? Of course not.

In both scenarios, however, that is precisely the case. That is because the municipal boundaries for Jacksonville (885 square miles) and Phoenix (517 square miles) are disproportionately large compared to the population of their city. Closer to home the same is true for Columbus (223 square miles), Indianapolis (368 square miles) and Charlotte (298 square miles) – all of which skew the average population density for cities east of the Mississippi downward due to their huge municipal footprints.

If you were to simply pick-up a daily newspaper and read the listing of America’s most populated cities, you would not get this full perspective and perhaps be misled to think that Columbus is the biggest city in Ohio, or that Indianapolis is the fifth largest city east of the Mississippi River.

Using this same practice, some might consider Cincinnati to be a small city that doesn’t even crack the top 30 in the United States.

Of course, we know all of this is skewed by all sorts of factors. Some cities sit on state or county lines, others follow historical boundaries from hundreds of years ago that have never changed, while other are granted more liberal annexation capabilities. In short, it’s politics.

Now if we were to look at America’s 30 most populous cities again, but rank them by population density instead of overall population, the picture would change rather dramatically. Most cities in the west fall considerably, while older cities in the east would rise. The outliers that have artificially inflated their boundaries over the years also fall into a more normalized position on the chart.

While Cincinnati is not in the top 30 in terms of population, we considered it anyways since this is UrbanCincy after all. After adjusting for population density, Cincinnati would vault all the way to the 16th “biggest” city in America, just behind Denver and ahead of Dallas. This is also more in line with Cincinnati’s metropolitan population ranking that falls within the top 30 in America.

Those cities in this analysis that are in the east have an average population density, outliers included, of 6,579 people per square mile, while those in the west, come in at 3,804 people per square mile.

If outliers like Jacksonville actually were as large as they project, and followed the average population density for the region, it would need to add close to 5 million people. Likewise, Indianapolis would need to add around 1.6 million people and Charlotte 1.1 million. Local politics and market conditions in each of these cities will never allow for this many new people to move within city limits.

The Washington Post is correct in that the west is getting more populated and urbanizing at a fast pace, but let’s not get ahead of ourselves. The most populated cities in the west would only be average, at best, in the east if they were judged by population density instead.

Now, factoring for population-weighted density would be an entirely different ballgame.

Categories
Business News

Here’s How Cincinnati Stacks Up When It Comes to Household Incomes

Recent data released by the Brookings Metropolitan Policy Program shows that Cincinnati’s middle class slightly worse off than its Midwestern peers, but is about on pace with the national average.

The study, which categorized individual metropolitan areas and gave regional averages, ranked each city’s population based on six household income categories: Bottom 20% ($21,433 and below); Second 20% ($21,433-$41,109); Middle 20% ($41,110-$65,952); Fourth 20% ($65,952-$106,100); Next 15% ($106,100-$200,000); and Top 5% (Above $200,000).

Cincinnati’s percentage of households making less than $21,433, 34.9% of the city’s population, is significantly higher than the Midwestern and national average 25.1% and 20%, respectively. It is also significantly higher than Pittsburgh (27.9%), but lower than Cleveland (43.2%).

The percentage of households in the middle class (I defined this as the Second 20% and Middle 20%), however, is mostly even. Pittsburgh’s middle class population stands at 41.1%, with Cincinnati at 40% and Cleveland at 39.2%. Cincinnati also stands in the middle when it comes to the upper class, with Pittsburgh again leading and Cleveland trailing.

When compared with the rest of Ohio’s cities with more than 100,000 people, Cincinnati is found to have the highest percentage of Top 5% households, while also having the third highest percentage of Bottom 20% households. This, researchers say, follows a national trend where large cities are over-represented in both categories.

A perhaps startling trend is just how poor so many people are across the Midwest and Ohio.

Of Ohio’s four cities with more than 100,000 people, three of them – Cleveland (#2), Toledo (#4) and Cincinnati (#5) – all rank near the top in terms of the highest percentage of their residents falling within the Bottom 20%. While Columbus comes in at #29, this may be due to the city’s large municipal boundaries that account for areas that would in no way be considered part of any of the other three cities.

While, on average, the study found that Midwestern cities tend to have more low income households, and significantly fewer upper class households than the rest of the nation, it also found that Western and Northeastern cities each have high populations of those making over $200,000, although the Northeast has the highest percentage of households making under $21,433.

Researchers did note, however, that these numbers change somewhat when adjusting for cost of housing across metro areas.

Alan Berube, author of the study and a senior fellow and deputy director at the Brookings Metropolitan Policy Program, also noted that despite media portrayals of some cities being entirely poor, and others being entirely wealthy, virtually all American cities still boast a large middle class.