Categories
Up To Speed

More than $64.3B to be invested in North American rail transit in 2013

More than $64.3B to be invested in North American rail transit in 2013.

As the migration of people from the suburbs back to cities continues, so does the investment in urban forms of transport. A modern streetcar route is currently under construction in Cincinnati, and bus rapid transit, light rail and commuter rail is all being studied for the area. Nationally, more than $64.3 billion is being invested to expand rail transit. More from The Transport Politic (including map):

What is evident is that certain cities are investing far more than others. Among American cities, Denver, Honolulu, Houston, Los Angeles, New York, San Francisco, Seattle, and Washington stand out as regions that are currently investing particularly dramatically. Toronto has the biggest investments under way in Canada. These metropolitan areas have invested billions of local dollars in interconnected transit projects that will aid in the creation of more livable, multi-modal environments. Dynamic, growing cities require continuous investment in their transit systems.

Categories
Business News Transportation

Following Zipcar’s Cincinnati expansion, car-sharing company acquired by Avis

Just 49 days after Zipcar announced that it would expand its services in Cincinnati, the car-sharing company announced that it had struck a deal to be purchased for $491.2 million by Avis.

The move by Avis, into the car-sharing sector, follows those of Enterprise and Hertz, and is seen as a critical evolutionary step for the traditional car rental company.

As the nation’s largest car-sharing company with more than 760,000 members, Zipcar offers its customers a way to move about urban environments without needing to own a car. Their slogan – “Wheels when you need them” – has increasingly hit home with young people that have been migrating back towards urban centers and ditching their cars.


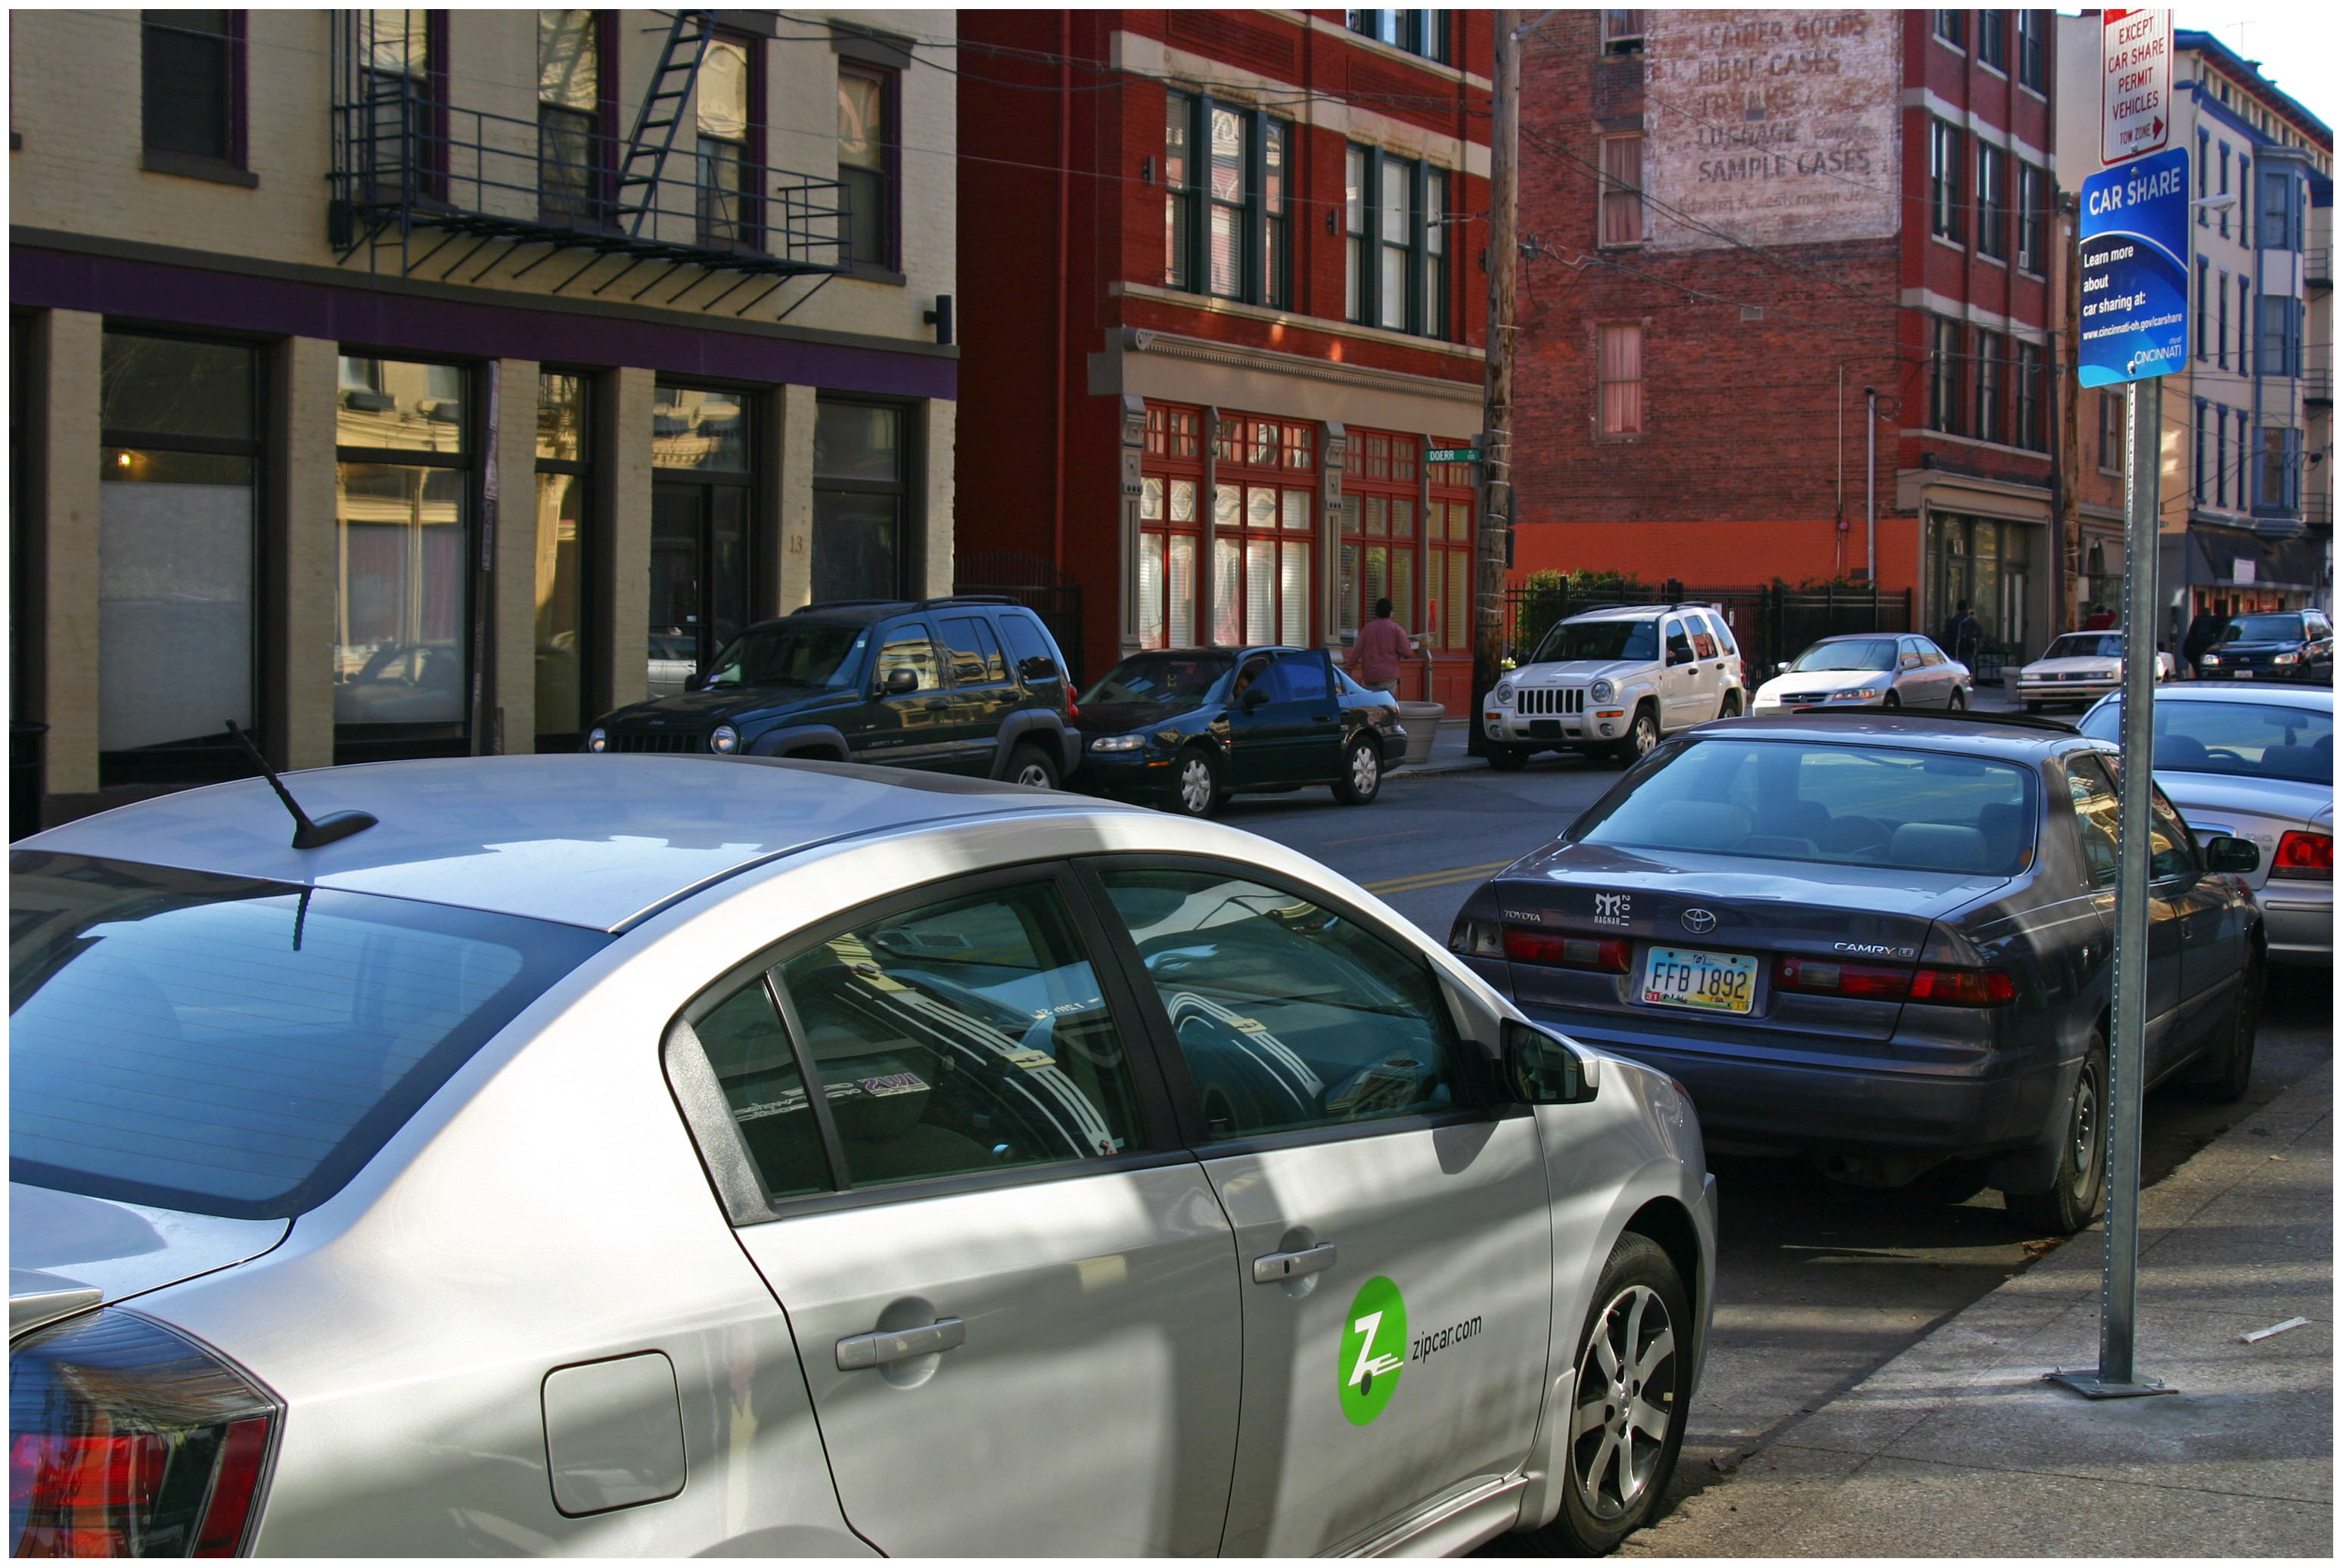
A Zipcar on 12th Street in between Vine and Race Streets. Photograph by Randy Simes for UrbanCincy.

According to the U.S. Department of Transportation (DOT), overall vehicle-miles traveled (VMT) have reached their lowest levels since 2003, and that per capita VMT to levels not seen since 1998.

Furthermore, the University of Michigan Transportation Research Institute has found that teenagers are delaying the pursuit of getting their driver’s license with just 31 percent of 16-year-olds getting their driver’s license in 2008.

“By combining with Zipcar, we will significantly increase our growth potential, both in the United States and internationally, and will position our company to better serve a greater variety of consumer and commercial transportation needs,” said Ronald L. Nelson, Avis Budget Group chairman and chief executive officer. “We see car sharing as highly complementary to traditional car rental, with rapid growth potential and representing a scalable opportunity for us as a combined company.”

While car-sharing continues to see explosive growth locally and nationally, now estimated to be a $400 million industry, it is yet to be seen what the merger will mean to car-sharing customers wary of getting behind the wheel of a “traditional” car rental company.

Wrote Adam Richardson in the Harvard Business Review, “Any time an incumbent acquires a disruptor there are challenges, and in this case, they stem from the very core of Zipcar’s existence: how it has created a sense of community with its customers and how it has used technology to create a scalable user experience that its customers love.”

Naturally, Zipcar leadership expects bright days ahead with more cars at more locations, new service offerings, and similar levels of service.

“This is a major win for Zipsters around the world,” Zipcar management wrote in an e-mail distributed to its customers. “With the global footprint, backing, and talented leadership of Avis, we’re going to step on the gas.”

Car-sharing has been available in Cincinnati since 2011. Rates start at $8.50 per hour, and 11 cars are available at five different locations in the Central Business District, Over-the-Rhine, Clifton Heights and Corryville.

Categories
Up To Speed

Should the FRA allow Amtrak to use lighter passenger trains?

Should the FRA allow Amtrak to use lighter passenger trains?.

Amtrak has historically been mandated by Congress to do all sorts of things that it otherwise would not willingly do on its own (i.e. run long distance routes to nowhere), but they are currently working to get the FRA to remove a regulation that would reduce its costs for operations and expansion. More from Slate:

Amtrak is going to push to get the Federal Rail Administration to change the safety regulations that force its passenger trains to be much heavier than the ones used in Europe and Japan. Relief from this rules has three kinds of advantages. One is that lighter trains use less fuel and thus are cheaper to operate. A second is that lighter trains can accelerate faster, making trips shorter.

Categories
Business News Transportation

Nate Wessel aiming to change the way Cincinnati does maps

Maps are used in our everyday lives to help us navigate our cities, perform research, and visualize spatial data, but Nate Wessel has attempted to change the way Cincinnatians view such information.

In June 2011, Wessel started a modest Kickstarter campaign that would raise money to print a transit frequency map he had developed. Instead of using the typical approach to developing a bus system map, Wessel adjusted colors and line weights according to the frequency of service along each bus route.
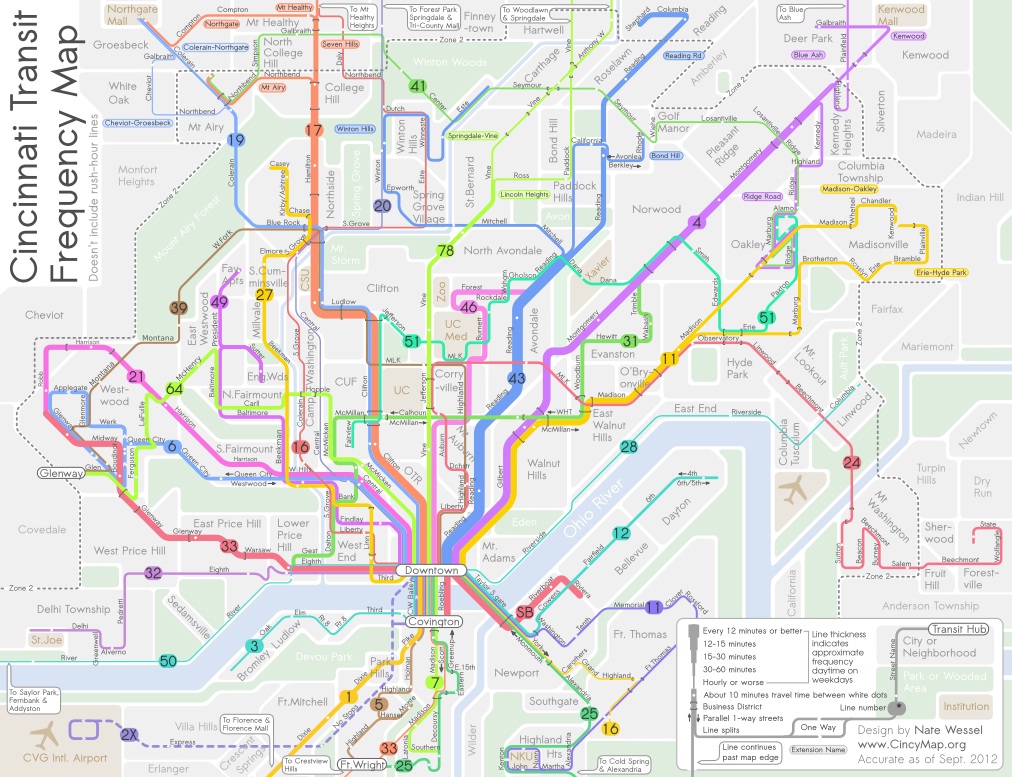

Cincinnati Frequent Transit Map (Day Time). Image provided by Nate Wessel.

While he simplified the system map, he also added critical wayfinding information such as neighborhood business districts, parks, neighborhoods and natural landscape features.

“The maps used currently will put the 38X on the same visual level as the 17, but one runs three times a day in each direction, and the other runs almost 100 times a day in each direction,” Wessel explained. “In no way does the map indicate any more value for one over the other, but my map gives people an approximate idea of how long you’ll need to wait, in addition to how frequent the buses come and where they go.”

Wessel grew up in Northeast Ohio and said that his first experience with transit was biking a mile to an unmarked bus stop in Canton. Since then he has studied urban planning at the University of Cincinnati (UC) and worked with the U.S. Department of Transportation, Bureau of Transportation Statistics.

It was during his time at UC, when he realized something needed to change with the way transit information is visually presented.

“A friend of mine from China was basically saying that he felt trapped in his apartment, and didn’t know anything beyond campus and thought you could take transit, but didn’t know where it went,” recalled Wessel. “He lived in a transit-rich area, but many people like him didn’t know the correct routes to take to the right places, even easily accessible places like downtown.”
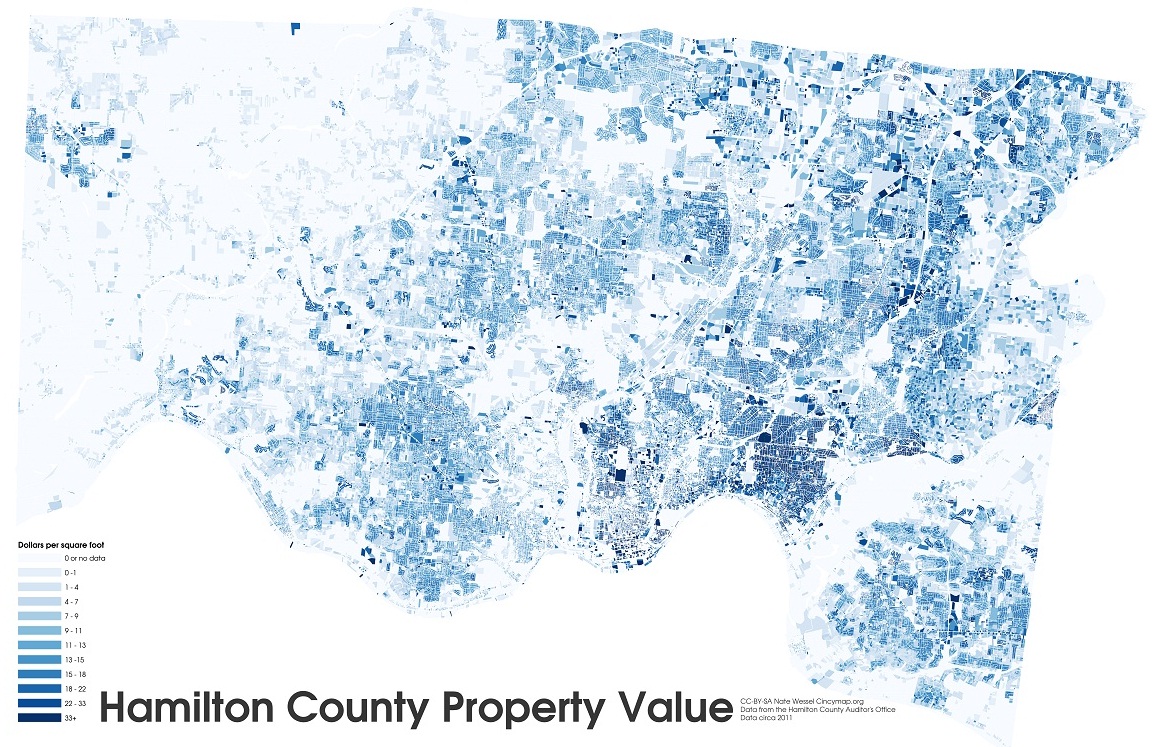

Hamilton County property values by square foot. Image provided by Nate Wessel.

The initial Kickstarter campaign raised far more money that Wessel was anticipated, and he was able to print and distribute 30,000 copies of his Cincinnati Transit Frequency Map. The map is now also featured on Southwest Ohio Regional Transit Authority’s (SORTA) website, but beyond that has not made significant inroads with regional transportation agencies.

Six months after Wessel distributed his new map, SORTA released a new regional transit map, for which they paid $20,000, that lacked the intuitive display and added information presented on the Cincinnati Transit Frequency Map.

While both SORTA and the Transit Authority of Northern Kentucky (TANK) were originally cooperative, and even contributed financially to the Kickstarter campaign, the follow-up, Wessel says, has been a bit disappointing.

Since the original release and distribution of the frequency map, Wessel has continued to improve upon it while also developing a separate night-time map, and one that focuses on center city transit service. To support those efforts, he launched a second Kickstarter campaign which funded the production of 20,000 additional maps in September 2012.

Wessel, however, has not limited himself solely to transit maps. He has released a number of maps this year that have highlighted property value data in Hamilton County, provided an exhaustive analysis of SORTA’s new transit plan, explained the theory of bus bunching, and is in the midst of an eight-part series critiquing the Cincinnati Streetcar project.

In the future he hopes to do a comprehensive map for bicycling to replace the existing one produced by the OKI Regional Council of Governments (OKI).

“In some way it’s a common interest in Cincinnati that I share with a lot of people that see the city not doing things as awesome as compared to other places, so I kind of want to do that with information about transit and cartography,” Wessel explained. “I also want people to make informed decisions about transit and planning in general, and I think that putting as much information out there in an attractive and useful manner helps.”
Nate Wessel was the winner of UrbanCincy’s first featured profile contest at the September 2012 URBANexchange. If you have a great idea we should know about, please contact the us at urbancincy@gmail.com. URBANexchange events are held on the first Wednesday of every month at the Moerlein Lager House.

Categories
Up To Speed

The Best Open Data Releases of 2012

The Best Open Data Releases of 2012.

The year 2012 is over. But it’s important to occasionally look back and see what we did well, and not so well, as a society over the last 12 months. One particular item that has become increasingly more significant in planning our cities is open data. From tracking crime in Philadelphia, bikeshare activity in Boston, transit usage in Atlanta, green roofs in Chicago, to rat sightings in New York City…open data has gone viral. More from The Atlantic on the top 10 open data releases of 2012:

Last year, Atlantic Cities named ten of its favorite metro datasets of 2011 from cities across North America, illustrating the breadth of what we might learn (regarding mosquito traps! misplaced vehicles! energy consumption!) in the still relatively young field of urban open data. For this year’s installment, we’re going one step further. Sure, raw data is great. But useful tools, maps and data visualizations built with said data are even better.

In this story, you’ll find our picks for 2012’s best open data releases from municipal vaults, with an emphasis on tools that can be used by anyone, not just developers and data geeks.