Categories
Development News

Columbus is not the biggest city in Ohio, and Indy’s not bigger than Boston

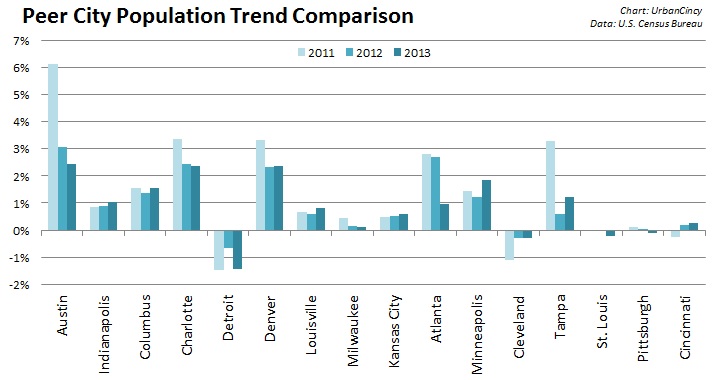
Following the release of the U.S. Census Bureau’s updated population numbers for American cities, much has been made about the urban rise of the west. Even the Census Bureau itself touted the growing number of cities with more than 1 million people – the vast majority of which are located west of the Mississippi River.

These numbers can be misleading, and often don’t even pass the smell test.

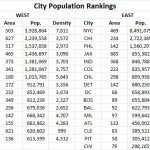
Is Jacksonville, for example, really a bigger city than Detroit, Washington DC, Atlanta and Boston? Or out west, would most people actually consider Phoenix to be a larger city than San Francisco, Seattle, Denver or San Diego? Of course not.

In both scenarios, however, that is precisely the case. That is because the municipal boundaries for Jacksonville (885 square miles) and Phoenix (517 square miles) are disproportionately large compared to the population of their city. Closer to home the same is true for Columbus (223 square miles), Indianapolis (368 square miles) and Charlotte (298 square miles) – all of which skew the average population density for cities east of the Mississippi downward due to their huge municipal footprints.

If you were to simply pick-up a daily newspaper and read the listing of America’s most populated cities, you would not get this full perspective and perhaps be misled to think that Columbus is the biggest city in Ohio, or that Indianapolis is the fifth largest city east of the Mississippi River.

Using this same practice, some might consider Cincinnati to be a small city that doesn’t even crack the top 30 in the United States.

Of course, we know all of this is skewed by all sorts of factors. Some cities sit on state or county lines, others follow historical boundaries from hundreds of years ago that have never changed, while other are granted more liberal annexation capabilities. In short, it’s politics.

Now if we were to look at America’s 30 most populous cities again, but rank them by population density instead of overall population, the picture would change rather dramatically. Most cities in the west fall considerably, while older cities in the east would rise. The outliers that have artificially inflated their boundaries over the years also fall into a more normalized position on the chart.

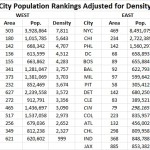
While Cincinnati is not in the top 30 in terms of population, we considered it anyways since this is UrbanCincy after all. After adjusting for population density, Cincinnati would vault all the way to the 16th “biggest” city in America, just behind Denver and ahead of Dallas. This is also more in line with Cincinnati’s metropolitan population ranking that falls within the top 30 in America.

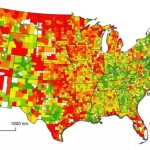
Those cities in this analysis that are in the east have an average population density, outliers included, of 6,579 people per square mile, while those in the west, come in at 3,804 people per square mile.

If outliers like Jacksonville actually were as large as they project, and followed the average population density for the region, it would need to add close to 5 million people. Likewise, Indianapolis would need to add around 1.6 million people and Charlotte 1.1 million. Local politics and market conditions in each of these cities will never allow for this many new people to move within city limits.

The Washington Post is correct in that the west is getting more populated and urbanizing at a fast pace, but let’s not get ahead of ourselves. The most populated cities in the west would only be average, at best, in the east if they were judged by population density instead.

Now, factoring for population-weighted density would be an entirely different ballgame.

Categories
Development News

Cincinnati Scores Slightly Better Than National Average on Sustainable Use of Land

Three percent of the Earth’s surface is developed land, not including farmland. While this may seem like a small percentage, it is the type of development that has created major problems for sustainable living conditions.

With an emphasis on single-family residential developments, auto-oriented planning, and an enormous supply of open land, it has become common knowledge that American cities are more sprawling than their global counterparts. These development patterns, although not entirely confined to the United States, are unique to American planning and have resulted in more sprawl and less sustainable development over the years.

This can plainly be seen by comparing dense European suburbs to American post-WWII sprawling suburbs. Further emphasizing this point today is that while the European Union has identified the percentage of developed land as one of 155 sustainable development indicators in terms of humanity’s ecological footprint, the United States has only noted its land use patterns but not used them as a factor in planning.

A new study, released in March by environmental engineering professors Dr. Giorgos Mountrakis and Dr. George Grekousis at the SUNY College of Environmental Science & Forestry, confirms the premise that America’s population growth does in fact consistently result in increasing land consumption, with the results varying between different states and counties where land management policies differ.

Their study used satellite imagery of the contiguous United States to measure the exact amount of developed land (DL) in 2,909 counties, excluding the outliers in the 100 least populated and 100 most populated counties. They then compared imagery from 2001 to the 2000 Census count in order to rank each county on what they call its DL efficiency. To make for more accurate comparisons, they then compared the results of each given county to the 100 counties closest to it in size (50 smaller and 50 larger).

Using this standard measurement, when Hamilton County was measured it came in at 43rd in its peer group. In this study, those counties with higher scores are considered to be more inefficiently developed. This means that Hamilton County came in slightly ahead of the curve when compared to its peers, which had an average rank of 51.

While the study shines a light on population growth and development patterns, it also reveals several socio-economic differences between similarly sized counties. Perhaps the most significant finding was that there seems to be a linear correlation between DL usages and population growth. For example, the researchers found that population growth of a county can be estimated by comparing its current DL usage to its past usage to then produce an estimate within a 95% confidence level. The larger the city gets, the more sprawling it will become at a consistent rate.

The study also confirmed that, compared to other developed countries, the United States is more inefficiently developed and that American cities tend to grow horizontally as population rises instead of vertically.

With this in mind, the report projects that the anticipated 30% population growth, between 2003 and 2030, will result in a 51% increase in land consumption. This equates to 44.5 million acres of land converted to residential and commercial development, and follows a trend of Rural Non-Metropolitan Statistical Areas developing land at nearly twice the rate of urban and suburban Metropolitan Statistical Areas.

One of the commonalities amongst low land consumption MSA counties, the SUNY researchers found, was that they were mostly located in states and cities with stronger planning agencies and urban growth boundaries. Furthermore, nearly all of the cities in these counties also had experienced rapid growth pre-automobile.

With a ranking of 43, Hamilton County comes in slightly better than the national average in its peer group. Elsewhere in Ohio, Clermont County ranked at 20 in its peer group, perhaps due to its makeup of 19th century towns and propensity of farms. And reflecting the dominance of post-war suburban housing, Butler and Warren Counties bring up the back of the pack at 62 and 55, respectively.

The three urban counties in Northern Kentucky, meanwhile, followed the larger trend for Kentucky overall and were found to be very efficient in their land use when compared to their peer groups.

For comparison, the Cincinnati metropolitan region as a whole scored better than those in Seattle, St. Louis, Kansas City, Orlando, Oklahoma City and Charlotte.

When Cincinnati’s population peaked in the mid-1950’s, it had over 500,000 residents within the city limits, while that number stood at just under 300,000 in the 2010 Census. This means that as the urban core continues to revitalize and add population, land that has become underutilized or abandoned will have the potential to be redeveloped, adding to the city and county’s density, and thus further improving its ranking.

Categories
Business Development News

Cincinnati Posts Population Gain for Second Consecutive Year

Cincinnati has added about 1,000 new people since the decennial census in 2010, according to new estimates released by the U.S. Census Bureau.

The modest increase comes from two consecutive years of population gains that followed an immediate downward revision after the 2010 Census. The increase also means that just Cincinnati, Columbus and Dayton were the only big cities (more than 50,000 people) in Ohio to post gains.

Columbus and Cincinnati, meanwhile, were the only big cities to post population gains for the past two years.

The population estimates are derived using the 2010 Census as a baseline and then factoring in new permitted residential construction and mobile homes, and subtracting out the estimated number of homes lost each year. As a result, all of the annual estimates should come with a grain of salt.

Ohio Cities Comparison

With that said, Dayton’s population gains appear to be an anomaly, while the increases in Columbus and Cincinnati appear to be more rooted. In any case, the news for Ohio’s big cities is not good as the rest all lost population, especially those in the northeastern part of the state.

Columbus continues to stand out from the rest of Ohio’s big cities in terms of its population trends. In this latest estimate release, Columbus posted the fifteenth largest numeric population gain of any municipality in America; and it comes on the heels of equally impressive gains in prior years.

Some observers, however, would attribute some of the gains in Columbus to its unusually large municipal boundaries that include what would be far suburbs in other Ohio regions.

While Columbus has been growing by about 1.5% annually over the past several years, Cincinnati has been growing annually by about 0.25%.

When compared with other peer cities, Cincinnati’s gains look even more tepid.

Peer Cities Comparison

Of fifteen other cities competitive with Cincinnati, the city bested only five of them in terms of population growth, while being significantly outperformed by most all others. In this comparison, even Ohio’s best performer – Columbus –fares only reasonably well against the field.

For Cincinnati’s peer cities, national trends appear to hold true. Southern cities continue to grow at the fastest clip, but their growth rates are leveling off. In our comparison, Austin, Atlanta and Tampa have all experienced significant declines in annual population growth since the 2010 Census. Charlotte has also experienced a similar trend, but appears to be holding steady more so than its Sun Belt peers.

Meanwhile, while many Midwestern cities continue to lose population, they are doing so at a slower rate or have stopped the losses entirely.

As we previously examined on UrbanCincy, the Cincinnati region continues to grow by about 0.4% annually. The City of Cincinnati’s 2013 gain represents approximately 12.5% of the total regional population growth, and half of Hamilton County’s increase last year.

In a nutshell, Cincinnati is over performing regionally, but under performing amongst its peers. If Cincinnati were growing as fast as Charlotte or Austin, the city would be adding around 9,000 new people every year.

Categories
Business News

Spanish-Language Workshop Hopes to Foster Immigrant Entrepreneurship in Cincinnati

The Cincinnati region struggles with attracting immigrants, even when compared with other nearby metros like Cleveland, Indianapolis or Louisville. X-LINK, an initiative from the Williams College of Business at Xavier University, has launched a program that its organizers hope will be a small step toward fixing that problem.

In partnership with the Cincinnati Hispanic Chamber of Commerce and the Greater Cincinnati Independent Business Alliance, Xavier University is starting LaunchCincy Juntos, a series of entrepreneurship workshops in Spanish (“Juntos” is the Spanish word for “together” or “united”) aimed at helping immigrants foster their ideas for starting a new business.

The group has organized four workshops to-date, with three having already taken place. Two were held in Price Hill and the third was held in Madisonville. The fourth planned workshop will take place in Norwood on June 14, and organizers say that more will follow suit.

Translated from English to Spanish by three undergraduates at Xavier University – Gali Zummar, Ronal Vieira, and Laura Forero – the first of these four workshops lit the flame for certain business ideas, and attendees were given specific assignments to develop their ideas further before their next class.

Noting that immigrants are more than twice as likely to start a business as native-born Americans, and currently lead the nation in terms of business creation, Xavier University and its partners say they want to reach out to the Latino community in Cincinnati to help create a better environment for Spanish-speakers to get their ideas onto paper and, hopefully, into business.

With immigration from Spanish-speaking nations maintaining its steady flow into the United States, Spanish is increasingly important for every aspect of American society, including business.

One example where Cincinnati’s struggles became quite clear was the relocation of Chiquita’s headquarters in November 2011. In addition to poor air service, Chiquita management cited the lack of Spanish-speaking professionals in the region as compared to Charlotte.

“Only 5% of the population speaks another language, which is very low, however 5% of two million is 100,000 people,” Alfonso Cornejo, President of the Cincinnati Hispanic Chamber, exclaimed during Episode 18 of The UrbanCincy Podcast when describing a new initiative focused on addressing this issue called Cincy Bilingual Talent. “If you can capture 3% of those 5% of them, then we’ll have thousands of people in the system who speak a lot of languages.”

X-Link plans to expand their Spanish-speaking program into Carthage this fall, in partnership with the Catholic Charities of Southwest Ohio and Su Casa Hispanic Ministries.

Categories
Up To Speed

Charlotte transforming city center through dynamic public investments

Charlotte transforming city center through dynamic public investments.

Cincinnatians have experienced first-hand what good public policy and investments can do to improve quality of life and economic value. New parks, improved infrastructure and expanded mobility options are sweeping through Cincinnati and it has been noticed nation-wide. Cincy’s not the only place taking this approach..Charlotte has also been investing in light rail lines, a streetcar, improved infrastructure and other public facilities like parks. More from the Charlotte Observer (including a video):

As soon as he was hired to lead Mecklenburg County’s parks seven years ago, Jim Garges heard the same criticism people had been saying about uptown Charlotte for decades. It had no life after 6 p.m. – it was nothing but a grand office park. Now on Labor Day weekend, Garges wants everyone to look at uptown again and explore its latest addition – the 5.2-acre, $11 million park to honor renowned artist and Charlotte native Romare Bearden.

“It’s a game changer,” said Garges, director of Mecklenburg County Park and Recreation. “People aren’t laughing anymore about uptown. It’s become the place to be.” It’ll take three days to grandly open the park that – with BB&T Ballpark next door and Bank of American Stadium blocks away – is sure to transform a piece of Third Ward that was once remnants of industrial buildings and gravel parking lots.