Categories
News Transportation

GUIDE: How to Ride the Bus in Cincinnati

So maybe you’ve been thinking for a while that you should actually take this ‘public transit’ thing that you’re always saying we need more of. Maybe you’ve been meaning to ride the bus to get to bars and shopping but put it off because you can’t figure out how to use the system. Or maybe you work downtown and would ride the bus, but you either get a parking or bus pass from your employer and you drive because it seems easier.

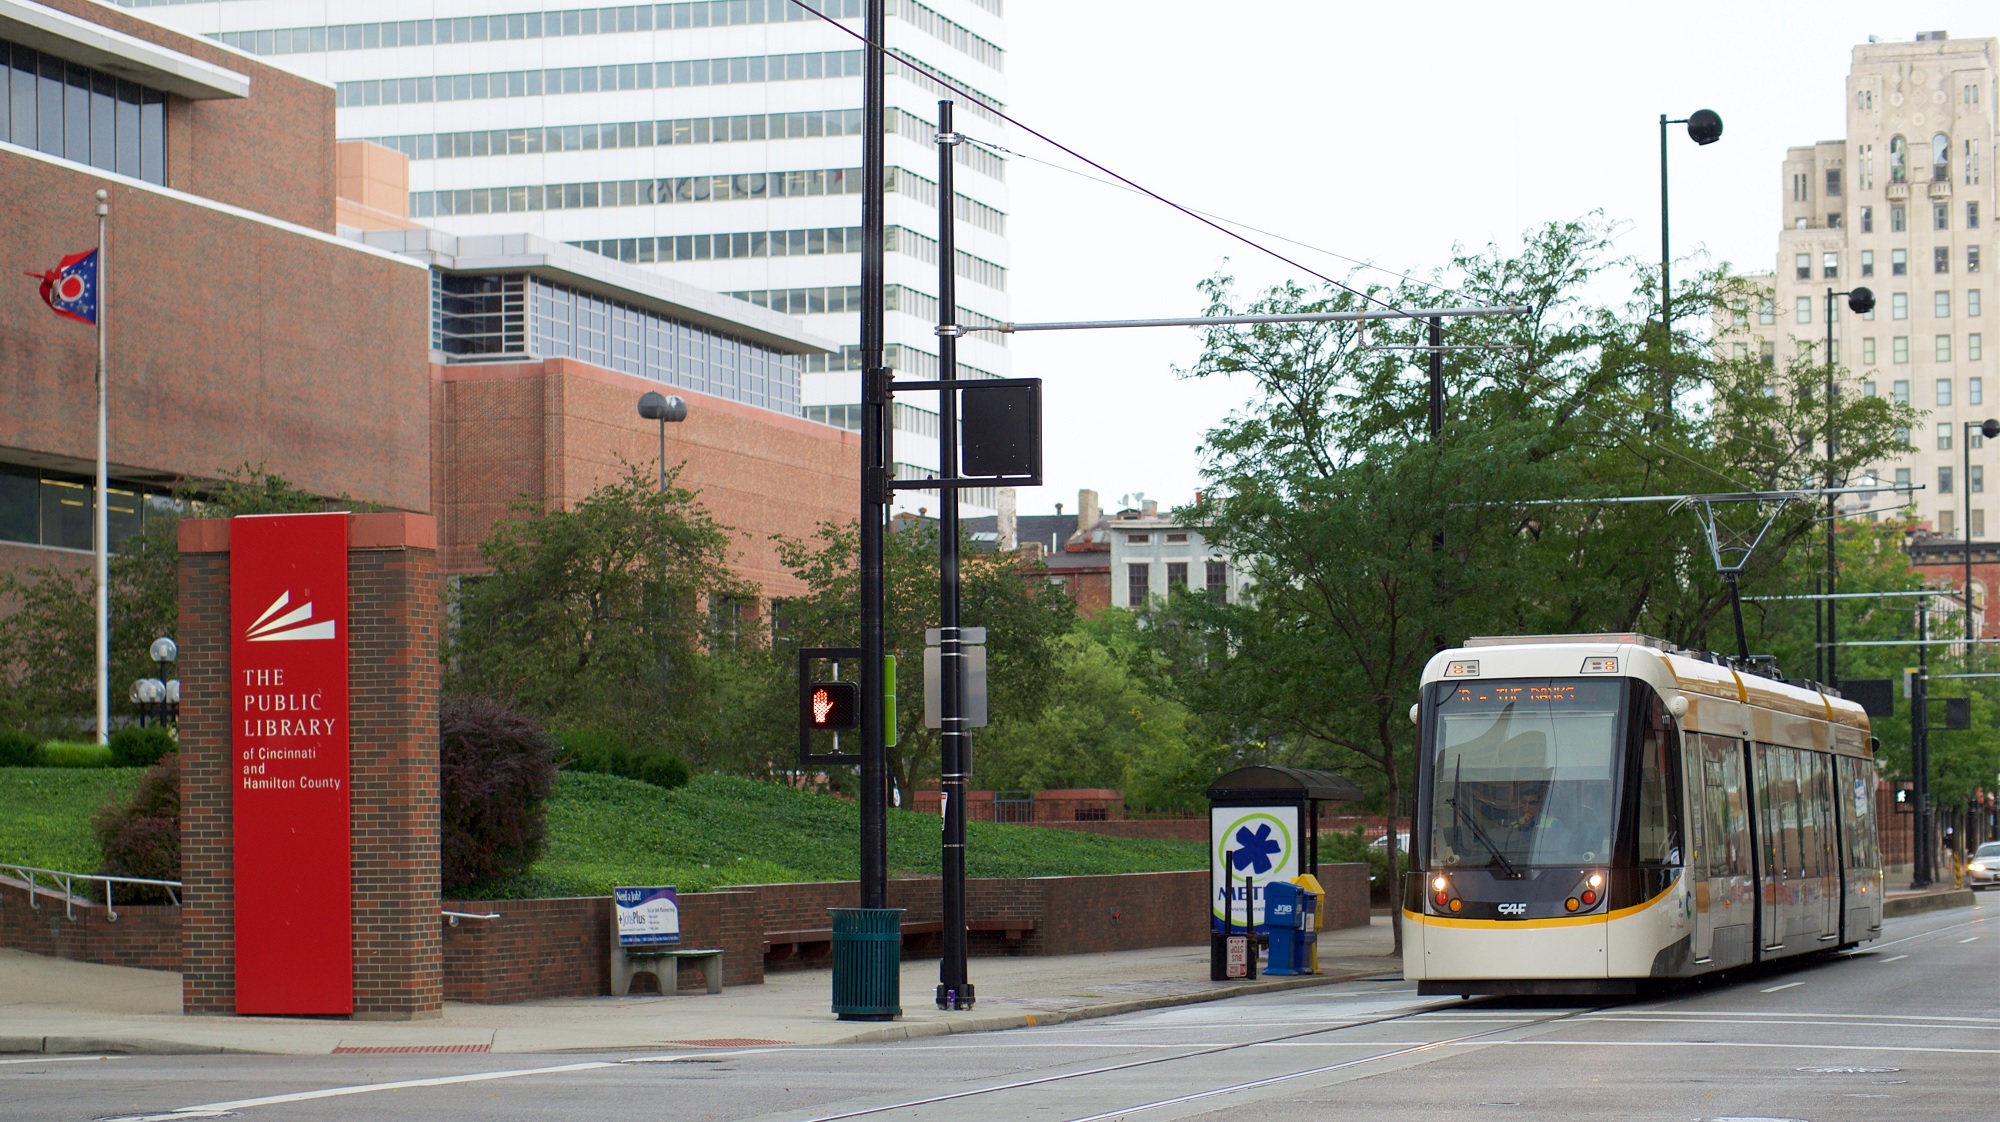
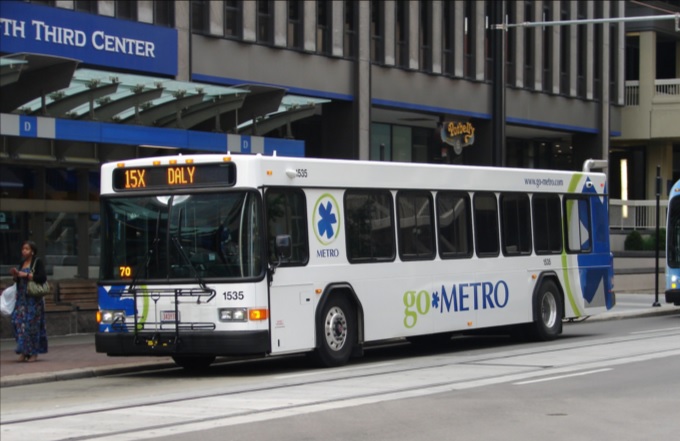
Regardless of the reason, there are many benefits to taking public transit as opposed to driving or taking a rideshare vehicle in Cincinnati. While our city gets a bad rap on the state of our bus system, the reality is that most of the city is easily accessible by bus. The 6 heaviest routes offer good daytime frequencies, serve the densest parts of the city, and are easy to understand when it comes to where they serve. These routes serve the arterial, or main, roads in Cincinnati, including Glenway, Hamilton/ Clifton, Vine, Reading, Montgomery, and Madison/Erie Avenues. Due to the geography and history of development in Cincinnati, most business districts and dense residential areas are on these roads. We are a lot more accessible than you might think!
But how do I use this bus? It may seem challenging to those who are not familiar with the system and how it works, but it’s nearly as easy as calling an Uber. In this article, I will address the three basic questions people have about riding the bus in Cincinnati: how do I know where it goes, how do I pay for my trip, and how do I not miss my stop.

Where Does the Bus Go?

There are several apps and websites that will plot the best route(s) to take as well as alternatives. Google Maps, which is standard on most smartphones, is easy to use and understand. Simply type in your destination and hit the transit icon as your travel mode and Google will do the rest. The app tells you where the nearest bus stop is, walking directions to the stop, and the estimated travel time once you are on the bus.

Another great app which offers much more functionality is the Transit App. This app gives the same directions as Google Maps does, but also includes a live tracker and time countdown of each bus on every route so you don’t have to wonder where the hell your bus is. The user interface is a little friendlier than Google’s as it is centered around transit usage. Additionally, the Transit App works in nearly every city worldwide that has public transportation options. It works especially well with multimodal travel and can estimate your travel time using a combination of travel modes like bike to bus, walk to bus, or bus to bus.

If you are more map-oriented and want to check out the entire route to learn where it goes, the Transit App has the ability to show the actual routing of each bus line and how long it would take to travel to each stop in the entire network by bus. Metro also offers its bus schedules and route maps on its website under Schedules. However, you must already know which line you are taking to take advantage of this.

Finally, you are always welcome to step onto a bus at your stop and ask the driver if this bus is going to X location. The drivers are knowledgeable about their routes as they drive them every day and will give you good advice on whether you should take this bus or another route nearby.

How Do I Pay for My Trip?

There are several ways to pay your bus fare with cash, credit/debit card, smartphone app, or stored value card. First, an explanation of the fare system. The fare in Zone 1, which includes the City of Cincinnati, Norwood, St. Bernard, Elmwood Place, Golf Manor, Delhi Township, and Cheviot, is $1.75 per rider. If you will need to transfer to another line to complete your trip, a transfer slip is an additional $0.50. Hot tip: if you are traveling somewhere and anticipate you will be returning by bus within 2 hours of first paying your fare, ask for a transfer and use that to return home. Transfers are good for up to 2 hours after requesting one and this can save you from spending another $1.75 for your return trip. If you are traveling outside of Zone 1 into Zone 2, the rest of Hamilton County, the one-way fare is $2.65 and transfers are still $0.50.

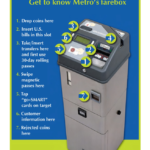
The most basic way to pay your fare is with cash, but keep in mind that the buses’ farebox does not give back change. If you only have singles, you will not be getting a quarter back for buying a Zone 1 ticket. Beyond paying cash you may purchase a stored value card, which you can load up with cash or by credit/debit card at any Ticket Vending Machine and select stores throughout the city. For example, the Clifton Market on Ludlow Ave sells stored value cards. You may put multiples of $10 on a stored value card. Don’t lose your card! Paying for your fare is as simple as swiping your stored value card on the bus, and it will automatically deduct your fare from the card’s balance. This removes the need to carry cash to pay the fare and is much easier and faster to use.

Finally, last year Metro introduced its Metro EZRide app which allows users to pay their fare with their smartphones. Once you have entered your credit/debit card information into the app you may purchase tickets on your phone at any time, to be used at any time. This also includes streetcar tickets. The app is quick enough that you can quickly buy a ticket as your bus approaches the stop if you forgot to beforehand. Simply activate your ticket as you step onto the bus and show the driver your screen. That’s it!

How Do I Not Miss My Stop

Generally speaking, Metro’s buses do not announce the stops they are approaching outside of major stops and transfer points. While some have good spatial minds and generally know where they are at all times, most people need a little help remembering which stop is their destination. I would recommend the Transit app as you can tell it to remind you when you are approaching the stop. Using your GPS location, the app will give you a notification and a ding in your headphones to alert you that you will approach your stop in about a minute. Alternatively, you can ask the driver to tell you when the bus has reached the stop you are going to, although if the bus is full they may be too busy with other passengers to remind you.

When the bus passes the stop prior to your destination stop you must alert the driver to stop the bus by pulling the yellow/grey cord strung up on the walls of the bus, push the vertical yellow tape near the doors, or push the red button on some of the poles coming down from the ceiling. Alternatively, you can yell “THIS STOP PLEASE” to the driver if you would prefer to do it that way. When disembarking the bus, use the back doors to exit so as not to block people entering the bus. This will result in a shorter trip time for everyone aboard.

Useful Links and Pictures

All Route Maps and System Network Maps

Bike & Ride Info

Nate Wessel’s Frequency Map is still up to date, frequencies are generally the same

Categories
Development Opinion

Opinion: Could Library Building Be Option for Public Radio Move?

If public libraries never existed in the United States their concept would baffle most people if proposed today: a 100% free and public space where tax dollars purchase and provide books, magazines, music, videos, technology, and other community services at zero cost to the individual. The public library has been a grand achievement in providing access to knowledge and services in this country, and the Public Library of Cincinnati & Hamilton County is no exception.

Our local library system is the 3rd largest publicly run library in the country, and the 15th largest when including university library systems. It is also the largest public library run at the county level with Boston and New York running city level systems. For perspective, Hamilton County’s library holdings are 52% larger than Chicago’s and more than double that of Cleveland, Seattle, Miami, and the state of Hawaii’s systems.

Like most public libraries, Hamilton County’s has undergone dramatic changes in services offered in the past decades due to the explosion in digital media and internet resources. While libraries still contain substantial physical holdings, most new resources are digital and require less space.

The Main Library branch in downtown Cincinnati was expanded in the 1990’s with the construction of the North Building, as the South Building was too full to hold new books and physical materials. According to the Public Library Board, the changes experienced by libraries over the past decades have rendered the North Building’s space unnecessary for current usage. Their reports suggest that the South Building could accommodate what the North Building houses today.

In 2016 and early 2017, the Board considered selling the building and underlying land to reduce its footprint and provide funds for branch renovations countywide. The Cincinnati Center City Development Corporation, better known as 3CDC, had been involved in advising potential futures for the building and the site. Protests followed this news, and the outcry pushed the Board to retain the property while finding new uses for the building.

This keeps the land public, alleviating concerns of those fearing a privatization of public assets in an era of dwindling public resources. To fund branch renovations the Board instead placed a 1-mill tax levy on the May 2018 ballot, which passed 63%-37%.

So what to do with the North Building? Aside from demolition the building, its redevelopment potential is restricted due to the high ceilings and massive floorplates which were necessary to hold the weight of hundreds of thousands of books.

Meanwhile, Cincinnati Public Radio (CPR), the license holder of WVXU, WMUB, and WGUC is looking to move. CPR’s current space in the CET Building and garage at 1223 Central Pkwy behind Music Hall has been rumored to be redeveloped in the near future, due to its proximity to the future FCC Stadium and the deteriorating condition of its public parking garage.

CPR has proposed siting its new facility near city hall, at 9th and Plum, a block that Indianapolis developer Milhaus has expressed interest in constructing apartments on since 2016.

Why fight over one parking lot when there are plenty of other options to pursue?

There is one option that would give CPR a new space and potentially satisfy the repositioning of the Library’s North Building: Move CPR to the North Building.

CPR needs large spaces for their studios and equipment, as well as office space. While they may not entirely fill the North Building, they could anchor a new era in the life of this critical public space in the region’s core. Ideas for the remaining space could include a museum on public radio and public libraries which could accompany CPR, as well as other public uses. There could be a news ticker that wraps around the building fronting on Vine and 9th Streets, giving updates to downtown residents, workers, and visitors.

As UrbanCincy previously explored, this area of downtown can be a reactivated with more residential housing. More residents help drive the vibrancy of the core and will help activate retail storefronts already in the area. Despite having city departments, Pure Romance, and other office users, retail activation still lags in this part of the neighborhood that has seen generations of demolition for parking.

A move to the North Building for CPR could potentially reactivate 9th street, be close the Cincinnati Streetcar and keep the space public. Likewise, continued residential development in the northwest quadrant of downtown will strengthen and reconnect that area of downtown to Over-the-Rhine and the new FC Cincinnati Stadium. Seems like this could be a win-win for everyone.

Categories
Development News

Cincinnati Scores Slightly Better Than National Average on Sustainable Use of Land

Three percent of the Earth’s surface is developed land, not including farmland. While this may seem like a small percentage, it is the type of development that has created major problems for sustainable living conditions.

With an emphasis on single-family residential developments, auto-oriented planning, and an enormous supply of open land, it has become common knowledge that American cities are more sprawling than their global counterparts. These development patterns, although not entirely confined to the United States, are unique to American planning and have resulted in more sprawl and less sustainable development over the years.

This can plainly be seen by comparing dense European suburbs to American post-WWII sprawling suburbs. Further emphasizing this point today is that while the European Union has identified the percentage of developed land as one of 155 sustainable development indicators in terms of humanity’s ecological footprint, the United States has only noted its land use patterns but not used them as a factor in planning.

A new study, released in March by environmental engineering professors Dr. Giorgos Mountrakis and Dr. George Grekousis at the SUNY College of Environmental Science & Forestry, confirms the premise that America’s population growth does in fact consistently result in increasing land consumption, with the results varying between different states and counties where land management policies differ.

Their study used satellite imagery of the contiguous United States to measure the exact amount of developed land (DL) in 2,909 counties, excluding the outliers in the 100 least populated and 100 most populated counties. They then compared imagery from 2001 to the 2000 Census count in order to rank each county on what they call its DL efficiency. To make for more accurate comparisons, they then compared the results of each given county to the 100 counties closest to it in size (50 smaller and 50 larger).

Using this standard measurement, when Hamilton County was measured it came in at 43rd in its peer group. In this study, those counties with higher scores are considered to be more inefficiently developed. This means that Hamilton County came in slightly ahead of the curve when compared to its peers, which had an average rank of 51.

While the study shines a light on population growth and development patterns, it also reveals several socio-economic differences between similarly sized counties. Perhaps the most significant finding was that there seems to be a linear correlation between DL usages and population growth. For example, the researchers found that population growth of a county can be estimated by comparing its current DL usage to its past usage to then produce an estimate within a 95% confidence level. The larger the city gets, the more sprawling it will become at a consistent rate.

The study also confirmed that, compared to other developed countries, the United States is more inefficiently developed and that American cities tend to grow horizontally as population rises instead of vertically.

With this in mind, the report projects that the anticipated 30% population growth, between 2003 and 2030, will result in a 51% increase in land consumption. This equates to 44.5 million acres of land converted to residential and commercial development, and follows a trend of Rural Non-Metropolitan Statistical Areas developing land at nearly twice the rate of urban and suburban Metropolitan Statistical Areas.

One of the commonalities amongst low land consumption MSA counties, the SUNY researchers found, was that they were mostly located in states and cities with stronger planning agencies and urban growth boundaries. Furthermore, nearly all of the cities in these counties also had experienced rapid growth pre-automobile.

With a ranking of 43, Hamilton County comes in slightly better than the national average in its peer group. Elsewhere in Ohio, Clermont County ranked at 20 in its peer group, perhaps due to its makeup of 19th century towns and propensity of farms. And reflecting the dominance of post-war suburban housing, Butler and Warren Counties bring up the back of the pack at 62 and 55, respectively.

The three urban counties in Northern Kentucky, meanwhile, followed the larger trend for Kentucky overall and were found to be very efficient in their land use when compared to their peer groups.

For comparison, the Cincinnati metropolitan region as a whole scored better than those in Seattle, St. Louis, Kansas City, Orlando, Oklahoma City and Charlotte.

When Cincinnati’s population peaked in the mid-1950’s, it had over 500,000 residents within the city limits, while that number stood at just under 300,000 in the 2010 Census. This means that as the urban core continues to revitalize and add population, land that has become underutilized or abandoned will have the potential to be redeveloped, adding to the city and county’s density, and thus further improving its ranking.