Categories
Opinion Transportation

CNU’s 2018 Transportation Summit: A New Traffic Model for Brent Spence Project

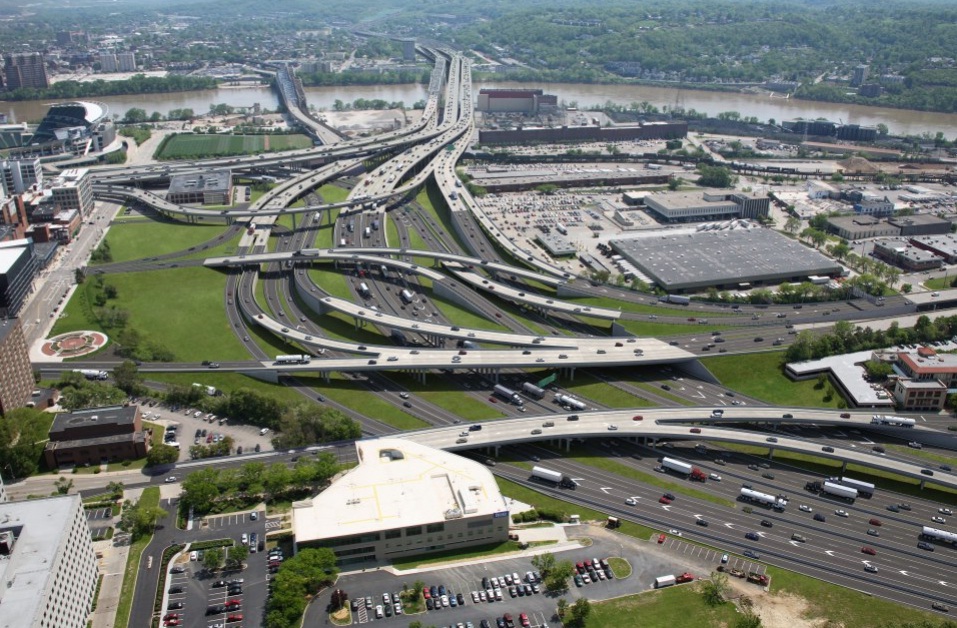
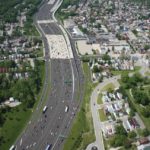
The underlying assumption of the Brent Spence Bridge project is that the level of congestion warrants relief with a new bridge and freeway expansion. The problem of congestion will be solved with new freeway capacity. However, that simple formula does not account for all the costs of the freeway expansion or the benefits not running a freeway through the urban core.

Two important pieces missing from the Brent Spence Bridge project cost/benefit analysis are the value of urban land and induced demand. As noted in a prior article, urban land is valuable. The sustained growth in Over the Rhine is local proof of the national trend that people want to live, work, and play in cities. Proponents of the bridge expansion project assume that the congestion relief is worth the price tag and loss of urban land for the next 50+ years. But what if the congestion relief is ephemeral?

Others in Cincinnati have described induced demand. To reiterate, it is the propensity for freeway lanes to fill to capacity once they are created. New capacity creates new demand. Decreasing the cost of driving with shorter, faster commutes, increases the number of drivers. Road expansions are intended to expand capacity and reduce congestion; however, new freeway capacity quickly fills up and becomes just as congested as before.

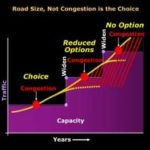
There appears to be no upper limit at which enough lanes eliminate capacity. The Katy Freeway in Texas provides the case in point. First constructed in the 1960s, it was six to 8 lanes wide. A $2.8 billion expansion project finished in 2011 that expanded it to one of the widest freeways in North America at 26 lanes: At one segment each direction has 6 lanes of through traffic, 4 feeder lanes, and 3 HOV/toll lanes. Travel times decreased immediately after the expansion, and in 2012 the Katy Freeway was hailed as a success story. However, by 2014, travel times increased 30 percent during the morning commute and 55 percent during the evening commute. $2.8 billion and 18 extra lanes improved traffic for three years, then made it worse than before the project. It achieved congestion relief for less than three years.

The predicted benefits of the Kary Freeway did not last. Cincinnati should learn from that lesson and include the effects of induced demand in the Brent Spence Bridge expansion cost/benefits accounting. The previous design did not adequately analyze induced demand.

Part of the reason that the project did not include induced demand as part of the analysis is that the software used to model traffic volumes is not up to the task. The model, called Static Traffic Assignment (STA), was designed to run on computers from the 1970s. Since you are reading this article on a computer there is no need to explain how much computers have changed in that time. There have been upgrades to the STA software but it retains the same fundamental architecture. STA produces usable predictions for daily traffic volumes but not for peak demand (rush hour). Accurate predictions of peak demand are necessary to understand induced demand.

There are two problems with STA that provide inaccurate peak demand forecasts. First, STA assumes roadway segments are independent, so that a problem in road segment “A” will not impact road segment “B.” In reality, congestion in one road segment does impact adjacent segments. Second, STA allows modeled traffic volumes to exceed capacity. If the model predicts capacity beyond what a given freeway can support, the model will queue vehicles up “outside the model.” In reality, those cars queued “outside the model” are either stuck in traffic or they’ve left the freeway and are taking surface roads to work.

The interstate system is a network that seeks equilibrium. If there is congestion in the network, drivers will avoid it. If there is capacity in the system, drivers will fill it up. The current Brent Spence Bridge project was modeled with STA. STA does not look at the network holistically. It either breaks up the system in segments or moves extra traffic outside the model. The failure to look at the system holistically makes it difficult for STA to predict where induced demand will come from and how intense the demand will be.

A better model now exists to forecast traffic. Called Dynamic Traffic Assignment (DTA), it is a more sophisticated computer model designed to run on contemporary computers. DTA holistically models an interconnected network in equilibrium. If a bottleneck causes a traffic backup, DTA assumes traffic will divert to surface roads rather than move outside the model.

The 2018 CNU Transportation Summit on Highways to Boulevards featured the presentation of a recent paper on DTA. Overall, DTA is a more powerful modeling tool that can better analyze effects on complex systems. There are five vehicular bridges over the Ohio River in Cincinnati, plus the two I-275 bridges. The traffic model must accommodate the regional impact of the bridge expansion on traffic, including the effects of induced demand. This is doubly important if the Brent Spence Bridge expansion is tolled and other bridges are not.

A DTA model of the Brent Spence bridge project will better show the impact of additional vehicles on local streets. Civic leaders in Cincinnati and Covington should have a better accounting of how moving an additional 50,000 vehicles per day through the urban core will affect their street networks, which must be paid for with city tax dollars.

Would it make sense to spend five years building the expansion project if the congestion relief dissipated within five years? Before moving ahead with such a large and expensive project there must be a full accounting of the costs and benefits. Particularly relevant to CNU, the loss of urban land has not adequately been included in the cost of the project. The benefit of congestion relief is diminished by induced demand. There are new tools at hand to better tally up these costs and benefits. A project the size and scale of the Brent Spence bridge expansion project requires a full and transparent accounting of the costs and benefits to move forward.

This is a guest article by Chris Meyer reporting on the 2018 CNU Transportation Summit. CNU and CNU Midwest are content partners with UrbanCincy. Chris is an Architect at Hub + Weber, PLC

If you would like to have your thoughts and opinions published on UrbanCincy, simply contact us at editors@urbancincy.com.

Categories
Up To Speed

Is the Great Lakes region ready to start acting like a megaregion?

Is the Great Lakes region ready to start acting like a megaregion?.

Only a small piece of land between Cincinnati and Dayton remains undeveloped, and many believe that remaining gap will disappear very soon. But the merging of Cincinnati and Dayton as one large metropolitan region is only part of the story, as shared regional identities with other large urban centers throughout the Great Lakes region becomes more pervasive. This and other regions like it around the U.S. are becoming even more centralized. More from The Week:

Though the concept has existed in academia for decades, planners are now looking at these dense corridors of population, businesses, and transportation and wondering if the megaregion may, in fact, be the next step in America’s evolution. With renewed interest and investment in urban centers and the projected growth of high speed rail, megaregions could easily become home to millions more Americans.

The Northeast corridor, for example, could receive up to 18 million more residents by 2050, according to estimates from the Regional Plan Association. And the region encompassing major cities in Texas including Houston and Dallas could see a spike from roughly 12 million to 18 million people in that same time, the association says.

And where population goes, economic growth is not far behind. The Northeast corridor would be the fifth largest economy in the world, with the Great Lakes megaregion at ninth and the Southern California megaregion outpacing Indonesia, Turkey, and the Netherlands as the 18th largest, according to 2012 estimates from real estate advisory RCLCO. The problem is, there are challenges to making these networks hold together. Unlike megaregions in Europe and Asia, for example, the United States has traditionally shied away from large umbrella governing organizations which surpass state borders.

Categories
Up To Speed

Should SORTA redraw its entire system? And if so, how?

Should SORTA redraw its entire system? And if so, how?.

On the latest episode of The UrbanCincy Podcast we discussed some ideas that Cincinnati would be smart to copy from other cities. One of the items discussed was a complete overhaul of the region’s bus network. Metropolitan Seoul did it in the early aughts, and Houston is in the process of doing it now. While there are numerous ways in which to go about doing this, one approach could be to crowd-source ideas from people using this bus routing tool. More from CityLab:

Not only does the tool give agencies a visually appealing way to present potential routes, but it enables them to respond to ideas—or, let’s face it, complaints—in real-time. If someone wants to move a bus route one street over, for instance, planners can just drag a line a few blocks and show that for an extra $250,000 the bus will now pick up just 10 more people a day.

“Transit for a lot of riders seems like just lines on the map,” he says. “This tool can really communicate to folks—much, much quicker than we’ve ever been able to— what changes to the system mean.”

Categories
Up To Speed

The world’s best cities have lots of traffic congestion, and that’s a good thing

The world’s best cities have lots of traffic congestion, and that’s a good thing.

When discussing transportation, the difference between traffic and congestion is often lost. There is, however, a difference between the two and that often plays a significant role in the livability of a city. What we have learned over the years is that congestion is often a good thing, particularly in cities. More from Streetsblog USA:

The pattern that emerges is that the places with the most traffic and driving also have the least congestion…Swan notes that the most congested places are also the places where people have good travel options that don’t involve driving. His chart suggests that car congestion itself is not the problem that needs to be solved — as long as there are other ways to get around, in a congested city few people will actually have to sit in traffic.

Categories
Business News

REPORT: Cincinnati Region Failing at Developing Walkable Urban Places

U.S. Metropolitan Land Use OptionsA recently released report conducted by The George Washington University’s Center for Real Estate & Urban Analysis in conjunction with LOCUS: Responsible Real Estate Developers and Investors, a coalition of Smart Growth America gave the Cincinnati region low marks for its walkability and growth patterns overall.

The report, entitled Foot Traffic Ahead, attempts to quantify the seemingly surging movement of people back into cities with a desire for walkable places.

The idea is that developers, investors, government regulators and financiers understood the model that successfully built America’s suburbs during the second half of the 20th century, but that a new model is needed with that era now behind us.

“Over the next generation, walkable urban development will spur even greater economic growth as demand for walkable urban development is met. The future growth of walkable urban places could provide the same economic base in the 21st century that drivable sub-urbanism did in the mid- to late-20th century. However, this growth will not be realized without appropriate infrastructure, zoning, and financing mechanisms at the federal, state, and local levels.”

Therefore, the authors of the report, in coordination with a Brookings Institution methodology developed in 2012, defined two primary forms of land use: drivable sub-urban and walkable urban. They also defined the two primary economic functions of those forms as being either regionally significant or local-serving.

Of the four potential combinations of these forms and functions, Foot Traffic Ahead focused on the regionally significant walkable urban places (WalkUPs) in each of the nation’s 30 largest metropolitan regions. When considering all of this, the authors of the report identified 558 WalkUPs nationwide, with 66 of those located in the New York City metropolitan area alone.

Out of the 30 regions studied, Cincinnati was ranked 20th with seven total WalkUPs in the region. Those seven WalkUPs, the report found, contained 33,234,000 square feet of office and retail space, or approximately 15% of the region’s total.

When compared with other regions, an astonishing 100% of the office and retail space located within WalkUPs were within the central city. What this means is that while Cincinnati’s urban core is extremely walkable, virtually nothing outside of it is. As a result, Cincinnati fell at the low end of the six regions classified as ‘Tentative Walkable Urbanism’.

“Four of these six metros – Houston, Columbus, Kansas City and Cincinnati – have 93% or more of their walkable urban office and retail space in the central city; virtually no walkable urbanism exists in their suburbs,” the report noted. “These four metros continued the expansion of drivable sub-urban development patterns.”

It is worth repeating that the methodology of this analysis places a priority on regionally significant places that contain at least 1.4 million square feet of office space, 340,000 square feet of retail space and a Walk Score value of at least 70 points throughout 100% of its area.

Such requirements penalize smaller and mid-size metropolitan regions that have less of this space overall. Perhaps illustrating this is the fact that while Cincinnati ranks 20th overall in this ranking, it comes in at 15th overall in terms of its number of WalkUPs per capita. Had the threshold for defining WalkUPs been lower, then perhaps more areas could have been considered into the overall WalkUP calculations for the region, and thus included smaller hubs outside of the central city.

When compared with the other regions, the future looks even grimmer for Cincinnati. In that ranking, Cincinnati falls five spots and into the category of ‘Low Potential for Future Walkable Urbanism’.

As is true with the existing rankings, the future rankings place a high significance on high volumes of real estate development. With regional growth rates hovering around 0.4%, it offers little opportunity for a region like Cincinnati to make dramatic changes to its development footprint.

However, when compared with the other regions, Cincinnati also appears to be lagging in terms of developing a robust regional transit system with both bus and rail, and lacks regional coordination on developing walkable urban developments. The report did however note that Cincinnati’s streetcar system currently under-construction serves as a bright spot that alone may shift the region from the ‘Low’ to ‘Moderate Potential’ category.

“These 13 metropolitan areas continue to lose market share in office and retail locating in their WalkUPs, continuing the mid- to late-20th century trend toward drivable sub-urbanism,” the report concluded about the regions with low potential in their future rankings.

Walkable Urbanism and GDP Performance Walkable Urbanism and Educational Attainment Education and GDP Performance

“In addition, they do not have substantial office rental price premiums. With 5% to 13% of office and retail space in WalkUPs, these metro areas have a long way to go to fully develop walkable urbanism.”

The real interest in the report, however, comes with its overall findings and correlations, as that is where the dire future outcomes may lie for the Cincinnati region.

In the report it found that regions with more walkable urbanism also had higher GDP performance, and that those same regions tended to have higher educational attainment.

“Given the relationship between educational attainment and walkable urbanism, and the relationship between educational attainment and per capita GDP, it is not surprising that walkable urbanism and per capita GDP are also positively correlated.”

According to the report, the six highest-ranked regions have a per capita GDP approximately 38% higher than the 10 lowest-ranked regions.

Of course, these findings alone cannot indicate whether walkable urbanism causes highly educated persons to move or stay away from certain regions, or whether places become more walkable due to there being more highly educated people there. But the correlations are strong enough that it is something that should make regional business and political leaders rethink the way in which Cincinnati develops.

“Although more research needs to be done to understand why walkable urbanism is correlated with higher per capita GDPs and education levels, this evidence suggests that encouraging walkable urbanism is a potential strategy for regional economic development.”