 A recently released report conducted by The George Washington University’s Center for Real Estate & Urban Analysis in conjunction with LOCUS: Responsible Real Estate Developers and Investors, a coalition of Smart Growth America gave the Cincinnati region low marks for its walkability and growth patterns overall.
The report, entitled Foot Traffic Ahead, attempts to quantify the seemingly surging movement of people back into cities with a desire for walkable places.
The idea is that developers, investors, government regulators and financiers understood the model that successfully built America’s suburbs during the second half of the 20th century, but that a new model is needed with that era now behind us.
“Over the next generation, walkable urban development will spur even greater economic growth as demand for walkable urban development is met. The future growth of walkable urban places could provide the same economic base in the 21st century that drivable sub-urbanism did in the mid- to late-20th century. However, this growth will not be realized without appropriate infrastructure, zoning, and financing mechanisms at the federal, state, and local levels.”
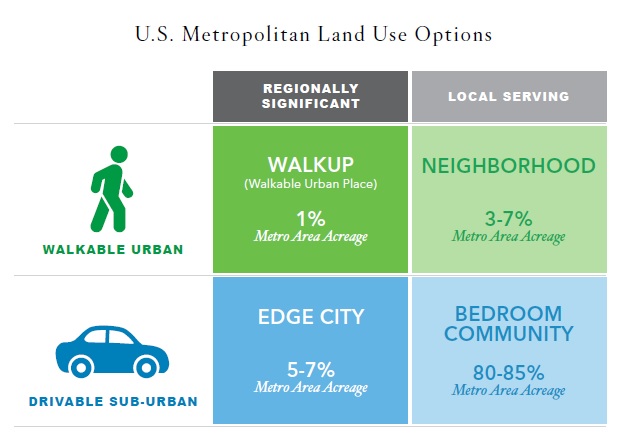
Therefore, the authors of the report, in coordination with a Brookings Institution methodology developed in 2012, defined two primary forms of land use: drivable sub-urban and walkable urban. They also defined the two primary economic functions of those forms as being either regionally significant or local-serving.
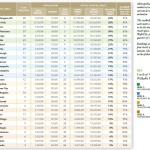
Of the four potential combinations of these forms and functions, Foot Traffic Ahead focused on the regionally significant walkable urban places (WalkUPs) in each of the nation’s 30 largest metropolitan regions. When considering all of this, the authors of the report identified 558 WalkUPs nationwide, with 66 of those located in the New York City metropolitan area alone.
Out of the 30 regions studied, Cincinnati was ranked 20th with seven total WalkUPs in the region. Those seven WalkUPs, the report found, contained 33,234,000 square feet of office and retail space, or approximately 15% of the region’s total.
When compared with other regions, an astonishing 100% of the office and retail space located within WalkUPs were within the central city. What this means is that while Cincinnati’s urban core is extremely walkable, virtually nothing outside of it is. As a result, Cincinnati fell at the low end of the six regions classified as ‘Tentative Walkable Urbanism’.
“Four of these six metros – Houston, Columbus, Kansas City and Cincinnati – have 93% or more of their walkable urban office and retail space in the central city; virtually no walkable urbanism exists in their suburbs,” the report noted. “These four metros continued the expansion of drivable sub-urban development patterns.”
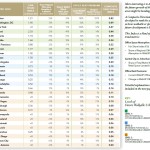
It is worth repeating that the methodology of this analysis places a priority on regionally significant places that contain at least 1.4 million square feet of office space, 340,000 square feet of retail space and a Walk Score value of at least 70 points throughout 100% of its area.
Such requirements penalize smaller and mid-size metropolitan regions that have less of this space overall. Perhaps illustrating this is the fact that while Cincinnati ranks 20th overall in this ranking, it comes in at 15th overall in terms of its number of WalkUPs per capita. Had the threshold for defining WalkUPs been lower, then perhaps more areas could have been considered into the overall WalkUP calculations for the region, and thus included smaller hubs outside of the central city.
When compared with the other regions, the future looks even grimmer for Cincinnati. In that ranking, Cincinnati falls five spots and into the category of ‘Low Potential for Future Walkable Urbanism’.
As is true with the existing rankings, the future rankings place a high significance on high volumes of real estate development. With regional growth rates hovering around 0.4%, it offers little opportunity for a region like Cincinnati to make dramatic changes to its development footprint.
However, when compared with the other regions, Cincinnati also appears to be lagging in terms of developing a robust regional transit system with both bus and rail, and lacks regional coordination on developing walkable urban developments. The report did however note that Cincinnati’s streetcar system currently under-construction serves as a bright spot that alone may shift the region from the ‘Low’ to ‘Moderate Potential’ category.
“These 13 metropolitan areas continue to lose market share in office and retail locating in their WalkUPs, continuing the mid- to late-20th century trend toward drivable sub-urbanism,” the report concluded about the regions with low potential in their future rankings.
“In addition, they do not have substantial office rental price premiums. With 5% to 13% of office and retail space in WalkUPs, these metro areas have a long way to go to fully develop walkable urbanism.”
The real interest in the report, however, comes with its overall findings and correlations, as that is where the dire future outcomes may lie for the Cincinnati region.
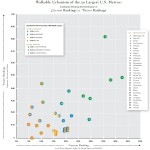
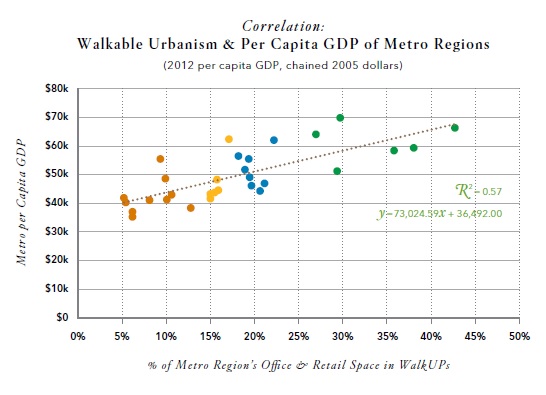
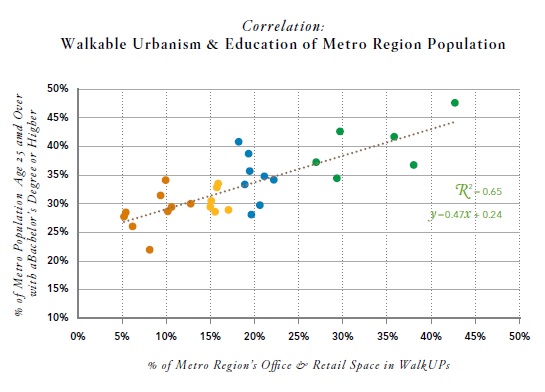
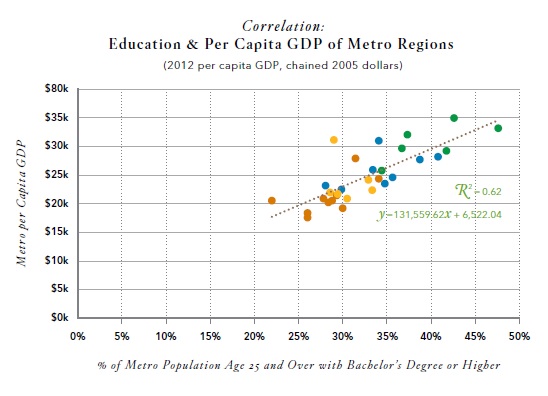
In the report it found that regions with more walkable urbanism also had higher GDP performance, and that those same regions tended to have higher educational attainment.
“Given the relationship between educational attainment and walkable urbanism, and the relationship between educational attainment and per capita GDP, it is not surprising that walkable urbanism and per capita GDP are also positively correlated.”
According to the report, the six highest-ranked regions have a per capita GDP approximately 38% higher than the 10 lowest-ranked regions.
Of course, these findings alone cannot indicate whether walkable urbanism causes highly educated persons to move or stay away from certain regions, or whether places become more walkable due to there being more highly educated people there. But the correlations are strong enough that it is something that should make regional business and political leaders rethink the way in which Cincinnati develops.
“Although more research needs to be done to understand why walkable urbanism is correlated with higher per capita GDPs and education levels, this evidence suggests that encouraging walkable urbanism is a potential strategy for regional economic development.”