Categories
Up To Speed

City neighborhoods with the most single men, women

City neighborhoods with the most single men, women.

Single men and women are often in a quest to find other single men and women. The quest leads people to debate which cities are best for singles, but what is the truth behind the rhetoric, and how do you think Cincinnati stacks up? More from Atlantic Cities:

To figure out where the gender ratio is most skewed in each direction, we went right to the data and looked at the ratio of men living alone to women living alone in order to assess the dating scene. We also subtracted estimates of the gay and lesbian population in order to focus on men and women interested in dating someone of the opposite sex. Finally, we excluded people older than 65 since differences in life expectancy skew the gender ratio in the later years.

In most metros, the neighborhood with the highest ratio of men to women is in or near downtown, as well as in recently redeveloped neighborhoods like Boston’s Waterfront or Long Island City. The neighborhoods with the highest ratio of women to men tend to be more residential, like San Francisco’s Marina and Seattle’s Queen Anne, and more upscale (and safe), like the Upper East Side and Upper Connecticut Avenue. Some are near major retail centers, like Chicago’s Near North Side, the Beverly Center in LA, and Atlanta’s Perimeter Mall.

Categories
Business Development News Politics

Inner-City Neighborhoods Center of Population, Economic Power in Cincinnati Region

The Cincinnati region has been one of the nation’s best economic performers over the past several years, and that has resulted in a 6.4% unemployment rate that is more than a point better the national average.

According to the U.S. Census, more than 968,000 jobs are scattered all over the region, but it is the City of Cincinnati that stands out as the dominant force for the 2.1 million person region.

As the numbers in the City of Cincinnati’s 2013/2014 Biennial Budget Report show, the financial standing of the central business district is critically important to the overall financial health of the entire city and county. According to the report, income taxes brought in $234 million last year – nearly 71% of the City’s total revenue in 2012.

Cincinnati Employment Density Cincinnati Employment/Population Share
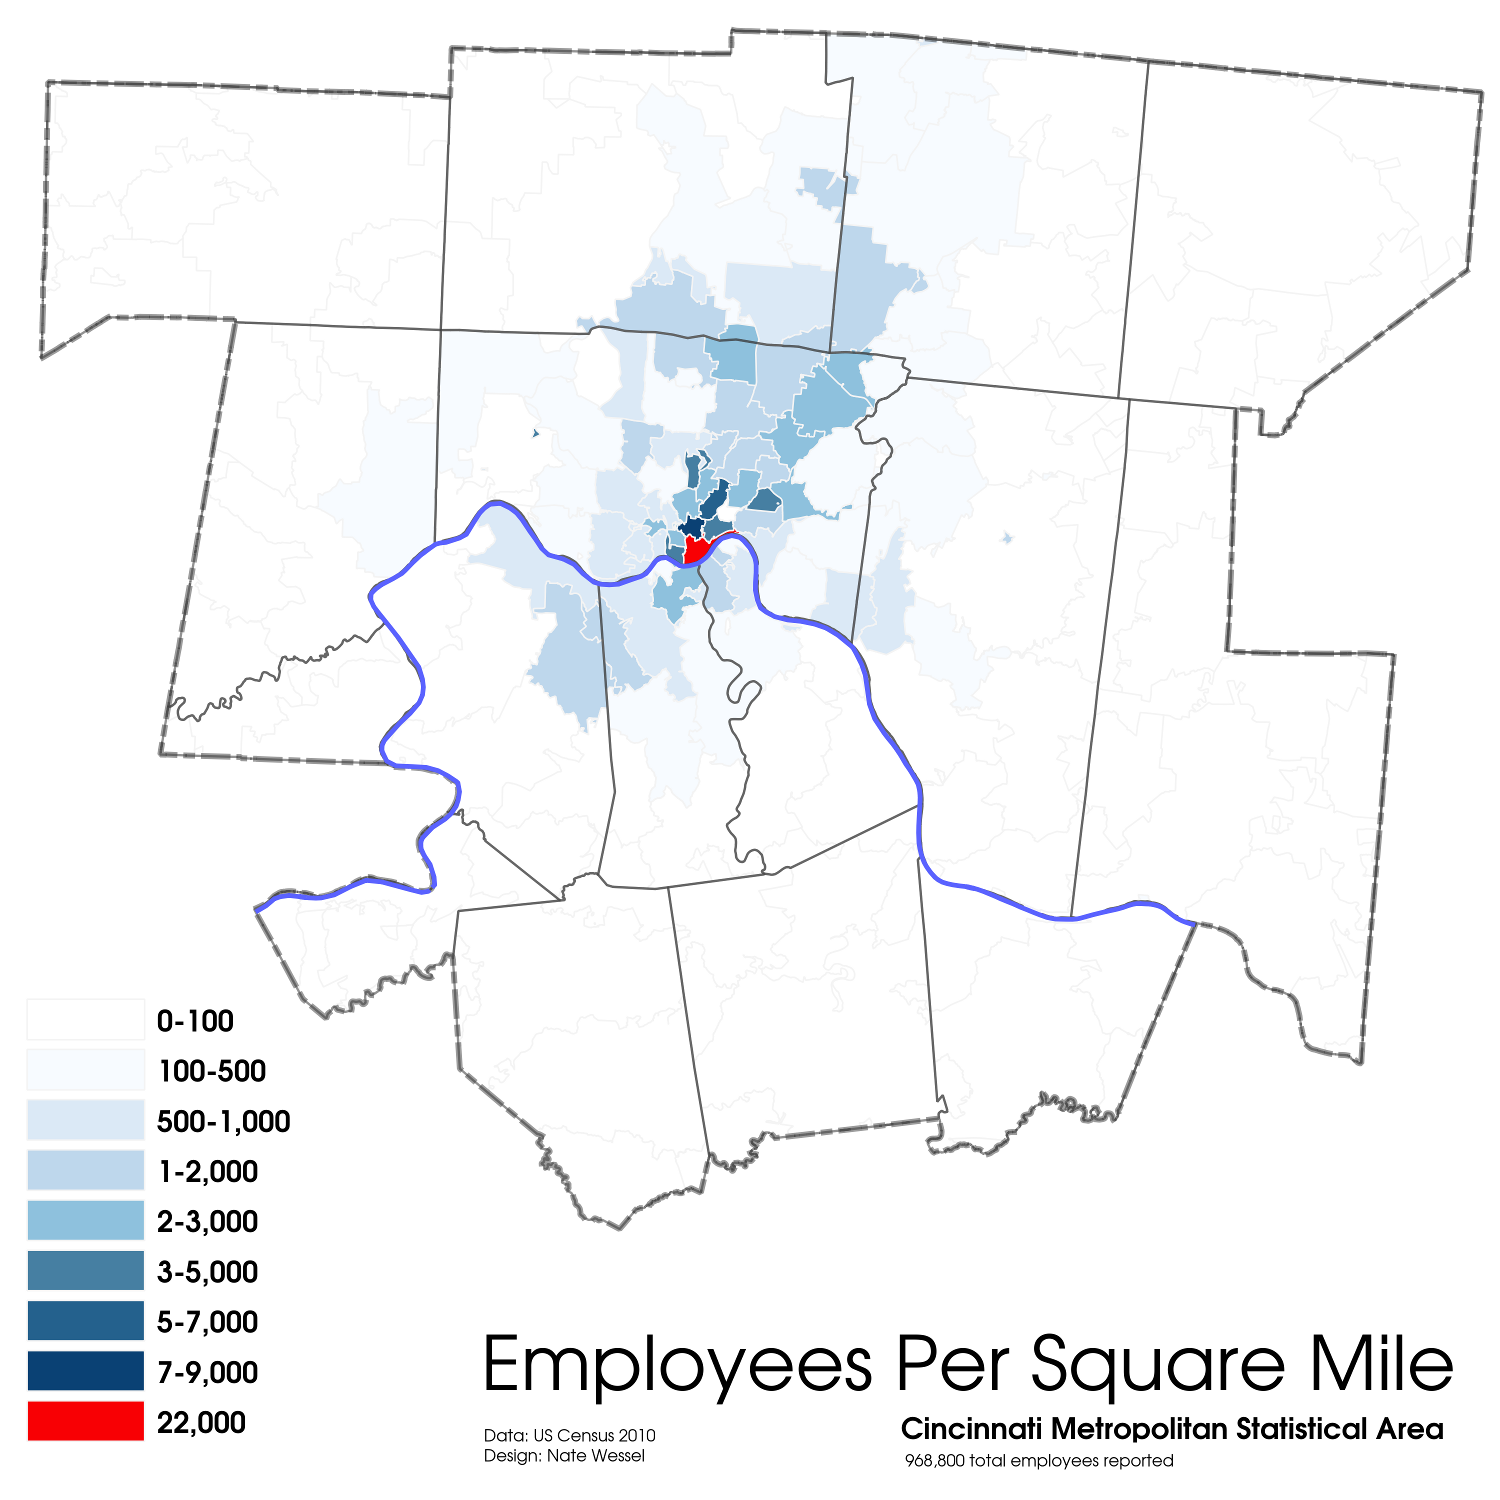
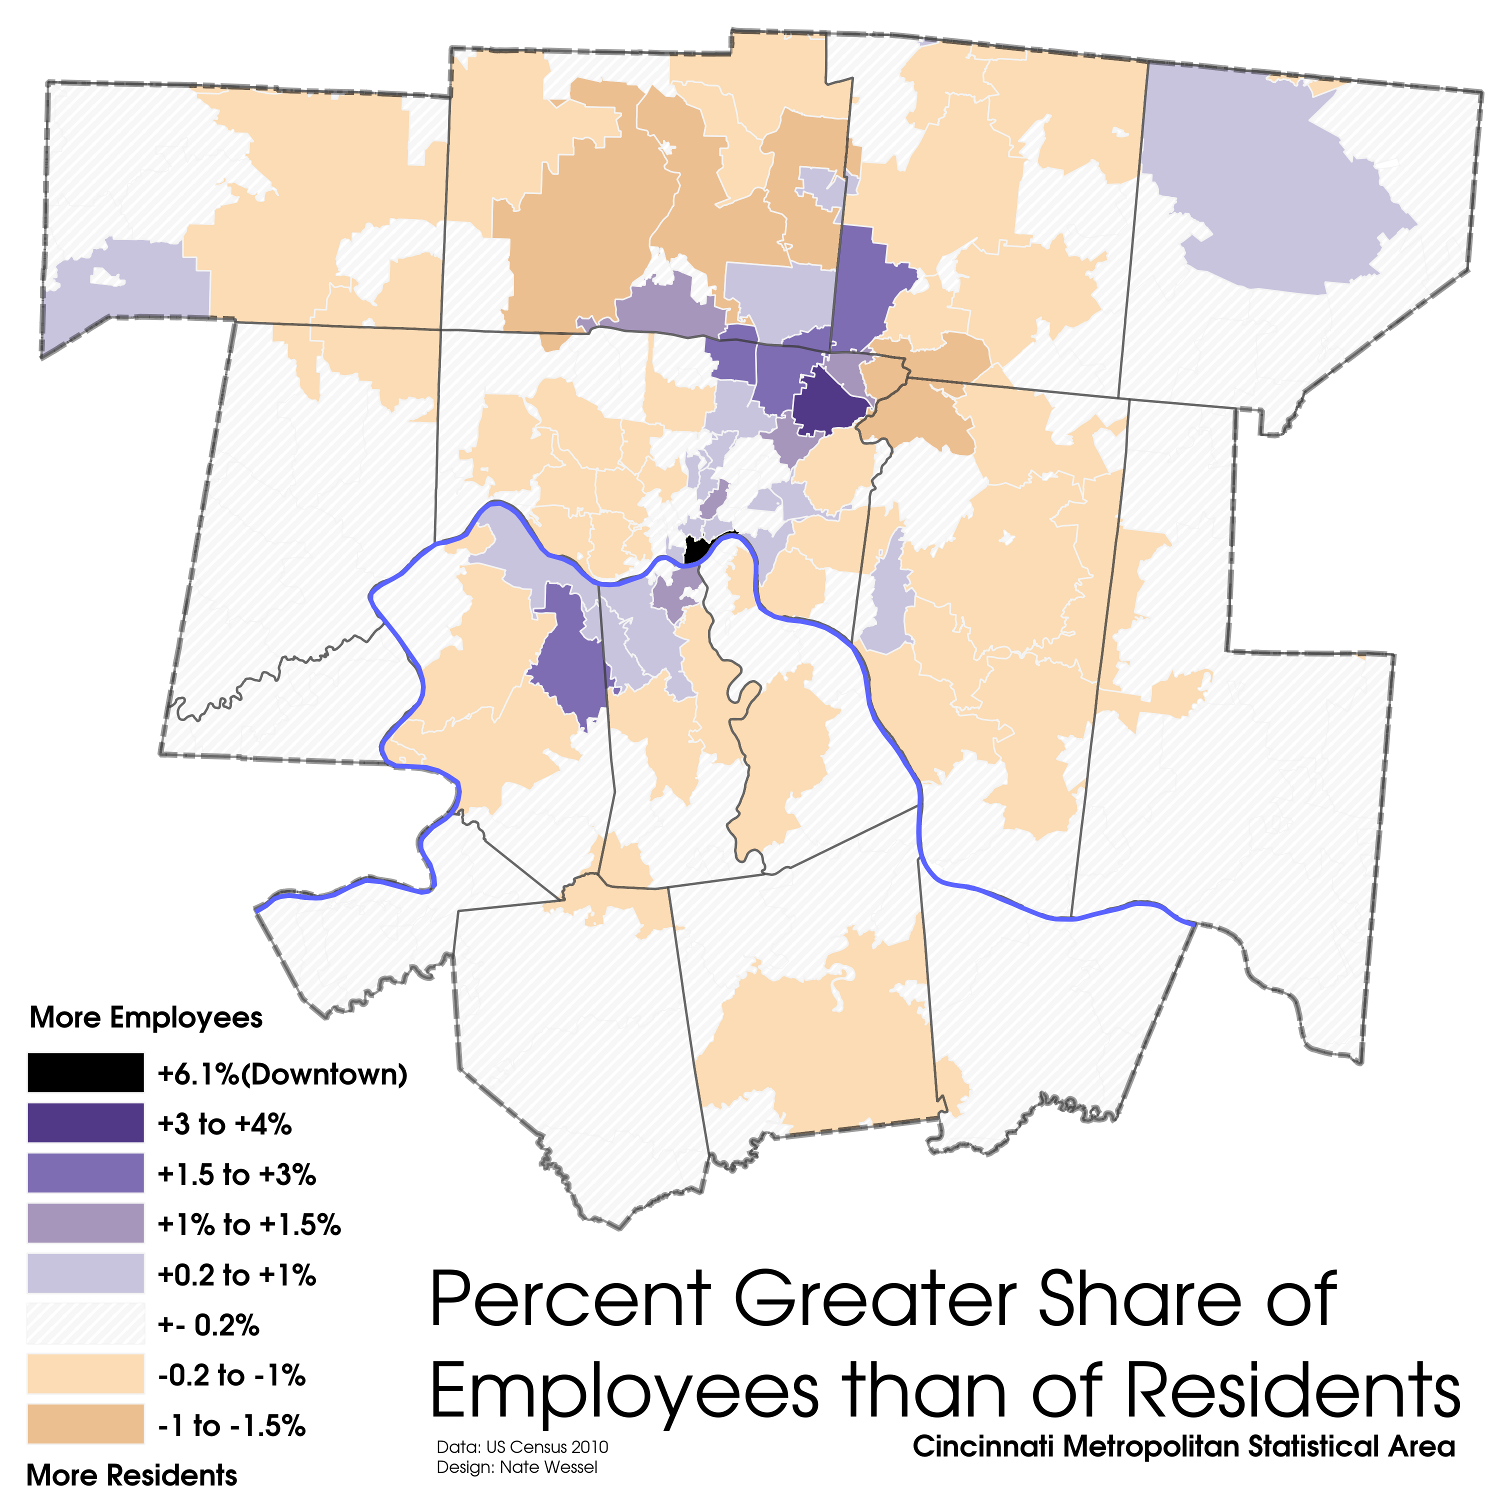
While outlying suburban communities have seen an influx of jobs over the past 30 years, Downtown and Uptown remain the region’s preeminent job centers. Employment Density Map and Employment/Population Share Map by Nate Wessel for UrbanCincy.

In the Cincinnati Metropolitan Statistical Area (MSA), center city neighborhoods account for the highest concentration of jobs, with more than 22,000 jobs per square mile in Downtown’s 45202 zip code, and anywhere from 3,000 to 9,000 jobs per square mile in Uptown neighborhoods.

“Downtown and Uptown are the City’s largest employment centers and therefore they are very important to the City’s financial health,” said Lea Ericksen, Cincinnati’s Budget Director. “We want all our neighborhoods to improve tax earnings by increasing residents, jobs and overall economic vitality, but we are focused on the six GO Cincinnati strategy areas for redevelopment.”

Cincinnati’s 2.1% income tax largely goes to support the General Fund which pays for operating expenses like police officers and fire fighters. Smaller percentages also go to pay for public transit operated by the Southwest Ohio Regional Transit Authority (SORTA) and capital investments in City buildings and infrastructure.

Ericksen projects that while income taxes will remain the same, they will grow in value by approximately 2.6% annually over the next six years.

Income & Property Tax Earnings (2004-2016)
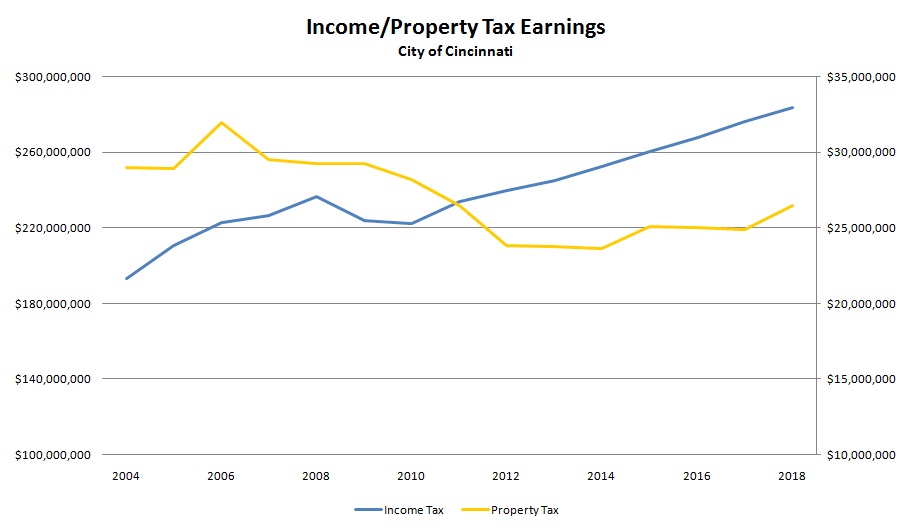
The City of Cincinnati has experienced steady growth in income tax revenues since 2004, but it has struggled to recover from the previous decade’s housing crash. Chart produced by UrbanCincy.

Property taxes are the next largest revenue generator for City Hall – accounting for $23.9 million in 2012. City officials expect this number remain stable over the next four years following an initial $7.8 million annual bump should the current property tax rollback be eliminated and set at 6.1 mils.

Like the clustering of jobs in the city’s urban core, the most heavily populated neighborhoods are also located within the center of the region.

“People are very interested in center cities, and we have an exceptionally attractive center city,” David Ginsburg, President/CEO of Downtown Cincinnati Inc. told UrbanCincy. “The architecture here and the geography that we have being in the valley. We just have a compact, spectacular downtown, and I think we have barely touched the surface of what the market can bear.”

Some of the most valuable residences are located along the central riverfront and eastside neighborhoods, with recent growth in northern communities in Butler and Warren Counties.

Cincinnati Population Density
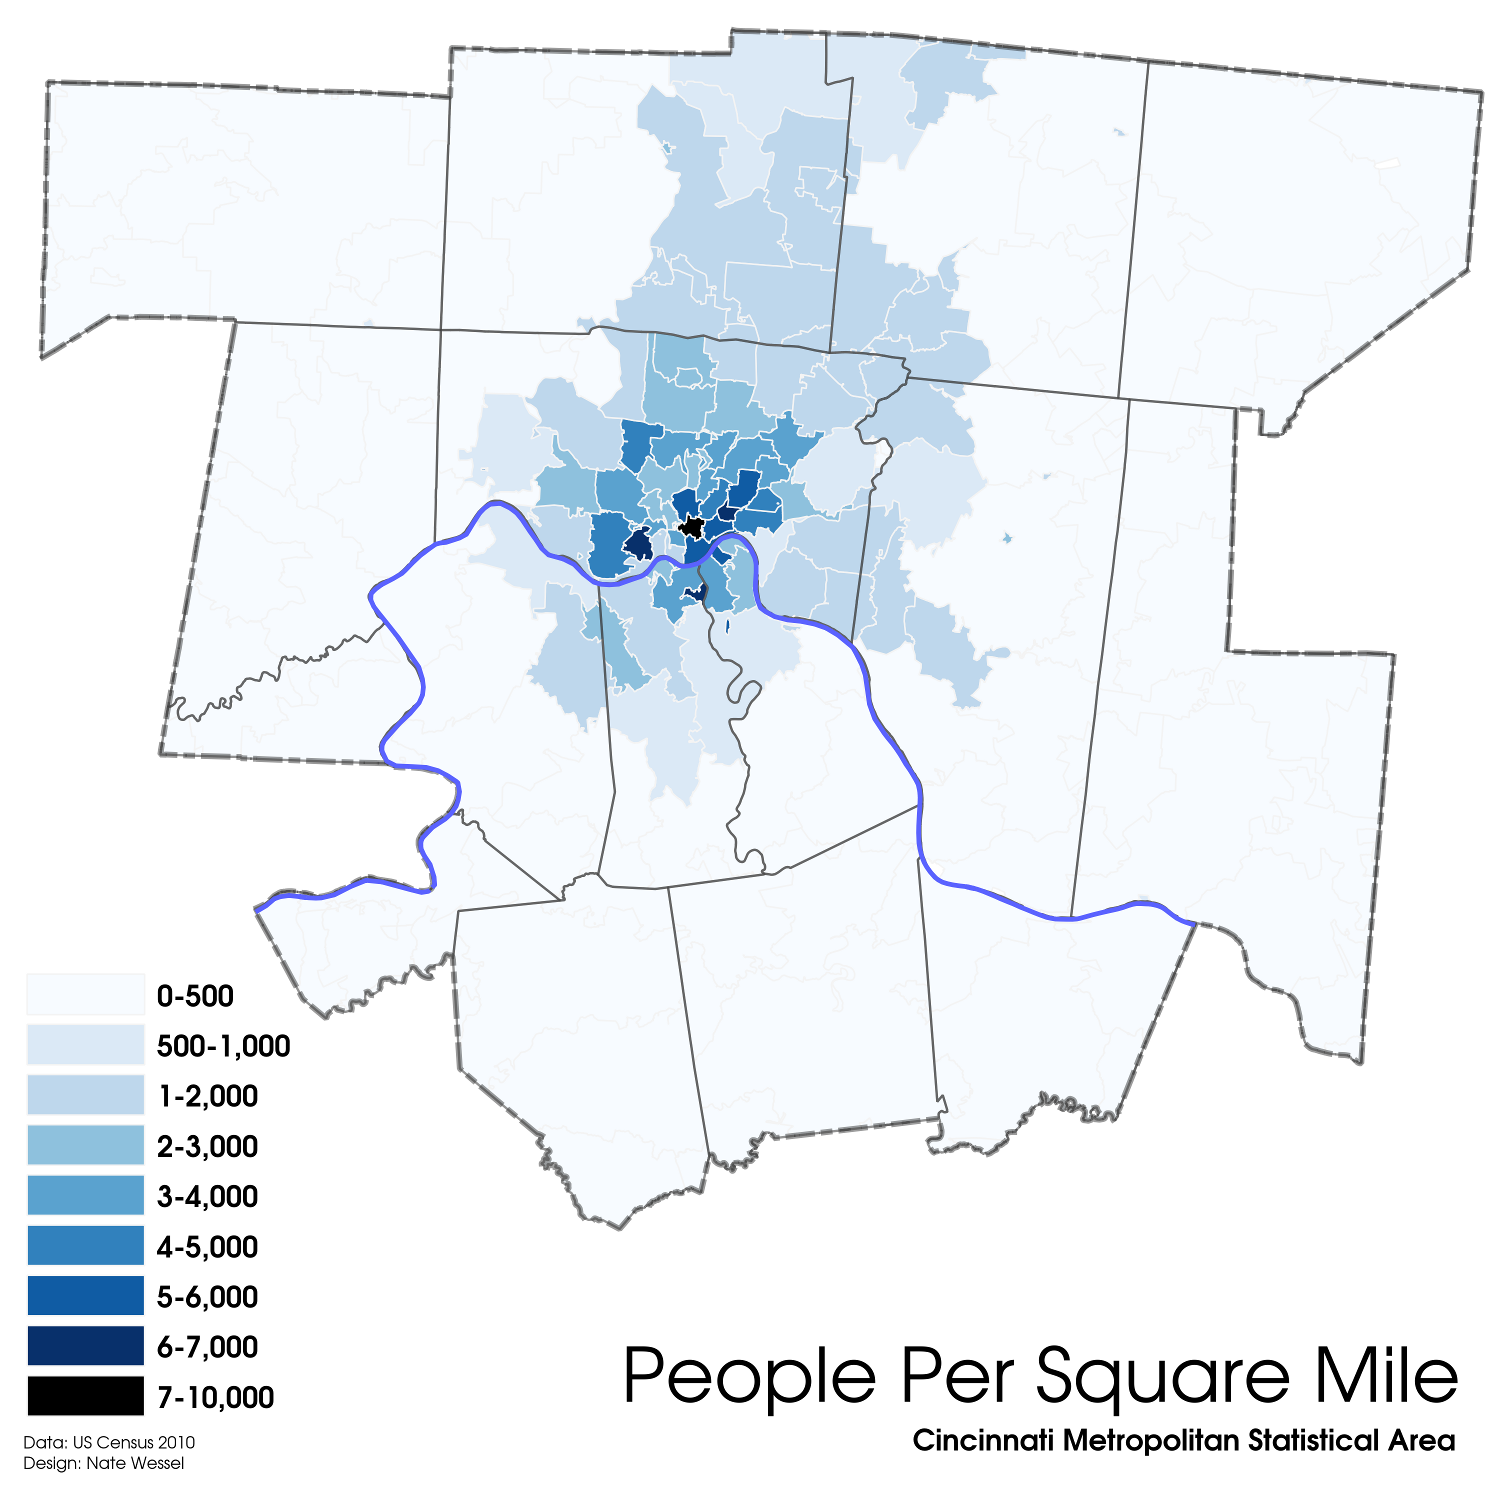
Several neighborhoods boast densities of 7,000 or more people per square mile, and those neighborhoods are all centrally located. Population Density Map by Nate Wessel for UrbanCincy.

Uptown neighborhoods surrounding the University of Cincinnati and Xavier University, Downtown/Over-the-Rhine, and close-in neighborhoods on the westside and along the Northern Kentucky riverfront are the most densely populated in the region.

“We’ve seen quite a bit of where we rehab a home, the neighbor decides to rehab their home,” Ken Smith, Executive Director of Price Hill Will, said about the development corporation’s Buy-Improve-Sell program which has rehabilitated 52 thus far in 30,000-person neighborhood, on episode 14 of The UrbanCincy Podcast. “People are very impressed with the housing stock in the neighborhood, and they are often quite impressed.”

Not all is well, though, for city leaders as they attempt to recover from the housing crash that took place between 2006 and 2010. Neighborhoods like East and West Price Hill are aggressively working to improve their residential housing stock by getting rid of vacant units even by taking advantage of hundreds of demolitions planned throughout the city.

“We are working with the Hamilton County Land Bank to get these empty lots into hands of those next door, but there are going to be a few houses that I wish we could save, and in better times maybe we would have the money to save it, but in better times they may not have gotten to that point,” explained Price Hill Will’s Matt Strauss, Director of Marketing & Neighborhood Promotion at Price Hill Will. “The goal is not only to bolster owner occupancy, but to increase property values in the neighborhood.”

Listen to episode 14 of The UrbanCincy Podcast with the leaders at Price Hill Will to hear more about the work being done on the westside to recover from the housing crash, and episode 15 with David Ginsburg to get the latest insight on the region’s economic engine. You can stream our podcasts online or subscribe to our bi-weekly podcast on iTunes for free.

Categories
Up To Speed

Washington D.C. plans $26B rail investment as Cincinnati moves on first

Washington D.C. plans $26B rail investment as Cincinnati moves on first.

As Cincinnati moves forward with construction of the region’s first rail transit, many residents are now looking forward to what might be next, and how to best connect the growing metropolitan area via rail. Meanwhile, in the nation’s capital, the Washington D.C. Metro has proposed $26 billion worth of upgrades to its already extensive system. More from the Washington Post:

Metro’s top managers are proposing a new rail tunnel under the center of the District, a second tunnel under the Potomac, and they estimate the transit agency will need $26 billion over the next three decades to pay for those and other improvements to an aging system that is falling behind the region’s needs.

The proposed new rail tunnels — one under 10th Street to Thomas Circle and another between Rosslyn and Georgetown and on to Thomas Circle — would be massive undertakings. The projects would require major financial commitments from local and federal governments and would take several years to plan and several more years to complete.

Categories
Up To Speed

Would elimination of the gas tax increase infrastructure investment?

Would elimination of the gas tax increase infrastructure investment?.

With user fees only covering approximately 51% of the costs to build and maintain roads, some are suggesting it’s time to change the way we fund our transportation infrastructure. One of those suggestions is to get rid of the gasoline tax altogether. More from Bloomberg:

As a result, “getting back our share” has become the key objective, so that every state now gets as much (or more) money in transportation grants as it pays in federal gas taxes. Along with the money, the federal government issues various rules for spending it, many of which require the states to put in some of their own money, too. It’s common to hear state transportation officials say that the feds provide 25 percent of the money and 75 percent of the hassle.

Eliminating the federal role would enhance state autonomy and streamline decision making. What’s more exciting is that it would also lead to more and better spending on transportation. In poll after poll, Americans say they are willing to invest in roads and bridges, as long as it brings about improvements they will use. This isn’t just talk; state and local referendums on raising taxes or issuing debt to pay for transportation projects usually pass.

However, people don’t generally support raising the gas tax, for the simple reason that they think their current gas taxes, which are mostly federal, are wasted. Thus, the federal gas tax has become both a ceiling and a floor. It makes raising state gas taxes unpalatable. And since states get back at least what they contribute, the tax encourages them to keep spending even if they don’t really need more roads.

Categories
Up To Speed

Bus rapid transit systems in the U.S. not keeping pace

Bus rapid transit systems in the U.S. not keeping pace.

Many American cities, Cincinnati included, are working towards enhancing their bus systems as ridership grows. Bus rapid transit systems consistently come up as potential solutions, but rarely are they true BRT systems. More from Greater Greater Washington:

The Institute for Transportation & Development Policy publishes BRT standards that describe minimum characteristics necessary for a bus route to qualify as BRT. Those standards establish three levels of BRT quality: bronze, silver, and gold. They include features like off-bus fare collection, high station platforms, and bus frequency.

So far, only 5 lines in the United States have scored highly enough to qualify as true BRT, and all 5 rank at the bronze level. Not one is even silver, let alone gold.

According to ITDP, the best performing BRT systems in the world are Bogota, Colombia and Guangzhou, China, which score 93/100 and 89/100, respectively. They are the gold standard.