Categories
Business News

What can UC’s School of Planning do to improve its graduates’ AICP exam pass rates?

The American Planning Association recently published their annual summary of AICP Exam pass rates of graduates from accredited planning programs, and both the University of Cincinnati’s masters and bachelors programs have once come in near the bottom of their respective quartile.

While some industry professionals believe the AICP credential no longer means what is used to, it is still, by and large, the distinguishing professional certification for professional planners.

The University of Cincinnati (UC) is one of just a select group of universities in North America with accredited masters and bachelors planning programs. Between 2004 and 2013, 65 out of 100 Master of Community Planning graduates passed the exam while 34 out of 68 Bachelor of Urban Planning graduates achieved a passing score. The total number of graduates taking the exam for both programs ranks them in the first and second quartiles respectively.

AICP Exam Pass Rates - Bachelor Programs
AICP Exam Pass Rates - Masters Programs

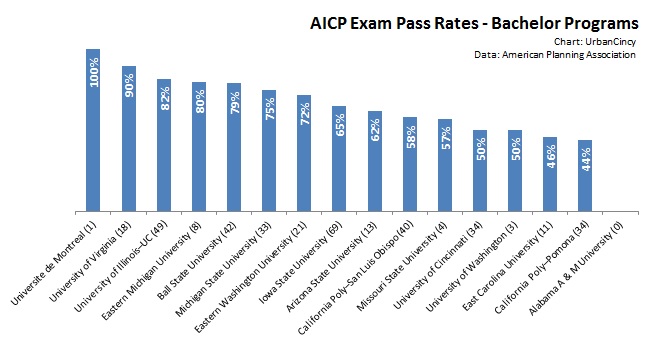
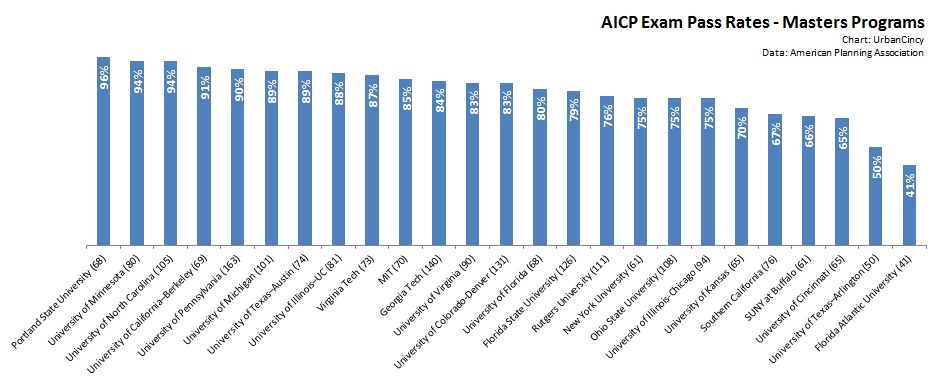
But while the overall number of planning students graduating from the University of Cincinnati’s planning programs is one of the highest in North America, their AICP Exam pass rates of 65% and 50% rank them near the bottom of their respective peers. These average scores also place both programs below the mean pass rate of 71% for accredited planning programs.

“The pass rates for both the MCP and BUP programs are very disappointing,” stated Dr. Danilo Palazzo, Director of UC’s School of Planning. “We have already met with the leadership from the Cincinnati section of APA Ohio and are devising a plan to make our students better aware of the topics covered by the AICP exam.”

One of the ways in which UC officials are hoping to improve this standing is by instituting a new course that would provide an AICP overview for those approaching graduation. The new course, however, does not yet have funding to support it twice per year as envisioned.

“I would like to believe that the pass rates are not a good reflection of the caliber of the professional planning education offered by our programs, though I will not make excuses. These low pass rates are unacceptable,” Dr. Palazzo emphasized. “We are very much open to the comments and suggestions from members of the AICP community, and would appreciate any actionable suggestions from your readers.”

Ohio State University’s Master of City and Regional Planning program, meanwhile, was the only other program in Ohio to be ranked. Its graduates passed the AICP Exam 75% of the time.

EDITORIAL NOTE: UrbanCincy’s owner and managing editor, Randy Simes, is a 2009 graduate of the UC’s Bachelor of Urban Planning program, and UrbanCincy’s local area manager, John Yung, is a 2013 graduate of UC’s Master of Community Planning program. Neither John nor Randy has applied to take the AICP exam.

Categories
Business Development News

Smale Riverfront Park Awarded $12.5M in Additional Public Funding

Dave Prather and the Cincinnati Park Board have released a new video update on Smale Riverfront Park. This latest update covers a lot of information due to the infusion of millions of new public dollars into the project.

In early March the U.S. Army Corps of Engineers (USACE) announced that they had awarded $4.5 million to Smale Riverfront Park to pay for erosion and flooding control along that portion of the Ohio River.

What it also means is that the Cincinnati Park Board can use other private funding it has received for other components that had been planned for the Heekin/PNC Grow Up Great Adventure Playground but put on hold until additional funding was secured. Those items include a shade canopy, sandbox, enhanced lighting and landscaping, shade trees, granite seat walls, and shade pergola.

Since this additional work can now proceed, project officials have adjusted the overall project schedule so that it can proceed immediately and be completed at the same time as ongoing work, which is slated to open in spring 2015 ahead of Major League Baseball’s All-Star Game to be held at Great American Ball Park.

The City of Cincinnati also approved $8 million in additional funding for the park at the end of last month. That money, officials say, will fund the rest of the next phase of work. City leaders also note that an additional $5 million in city funds will be needed for the project in 2017 to fully complete the park.

The new funding from USACE is the first federal investment in the project in years following a ban on earmark spending that had jeopardized the schedule for completion for the 45-acre central riverfront park.

Categories
Business Development News

Hamilton County Posted Largest Population Gain in Cincinnati MSA in 2013

New population estimates released by the U.S. Census Bureau last week show that Hamilton County’s population slide has ended and that the Cincinnati metropolitan region remains the largest in Ohio, Kentucky and Indiana with more than 2.1 million people.

In 2013 Hamilton County added more than 2,000 new people – making it the biggest gainer in the 15-county tri-state region. Warren County came in a close second with just under 2,000 new people.

Boone and Kenton Counties in Kentucky and Clermont County in Ohio also posted population gains of more than 1,000 people. Meanwhile five rural counties in the region saw their population decline, with Brown County in Ohio losing the most at an estimated 165 people.

The Cincinnati region as a whole is estimated to have added just over 8,000 residents in 2013.

Cincinnati MSA Population Changes 2010-2013

Over the past year, the region also posted gains in terms of international migration, but saw continued losses for domestic migration. Net migration to the Cincinnati region was actually negative, but thanks to births significantly outpacing deaths, the region was able to post its overall population gain.

When compared to Columbus and Cleveland, Cincinnati lags in terms of international migration numbers.

Columbus, meanwhile, is the only region out of the big three in Ohio that posted gains in both international and domestic migration – making it the only metropolitan area in the state to have positive net migration in 2013.

Regionally, Hamilton County was the only county to see more than 1,000 new international migrants. But at the same time, Hamilton County also recorded the largest domestic migration loss of any county in the region.

While most all of Hamilton County’s population gains can be attributed to births exceeding deaths, approximately half of Warren County’s gain can be attributed to its positive net migration over the past year. Aside from Warren County, only four other counties in the region experienced positive net migration.

Ohio Metropolitan Region 2030 Population Projection

The population estimates continue to look bad for Cleveland, which recorded regional population loss once again. Since the 2010 Decennial Census, Cleveland has posted average annual population losses of 0.2%, while Cincinnati and Columbus have posted gains of 0.4% and 1.1% respectively.

Should these trends hold over the coming years, Columbus will follow Cincinnati’s lead and pass Cleveland, once the state’s most populous metropolitan region, in terms of overall population by 2017.

Due to the faster growth taking place in Columbus, it will also eventually catch and pass Cincinnati as the state’s most populous region a decade from now. Cleveland, meanwhile, will see its regional population dip below two million in 15 years.

A long forecasted but yet realized trend appears to be taking hold in the second decade of the new millennium. Instead of cities bleeding population to suburban areas, rural areas are now losing their population to suburban areas while cities hold on to their core population while also continuing to attract international and some domestic migrants from suburban and rural areas.

The Decennial Census in 2010 was a splash of cold water for many cities, including Cincinnati, who had thought that they had already reversed decades of population loss. Perhaps these new trends, now being realized, will finally result in the population gain so many cities have been longing for in 2020.

Categories
Business News Transportation

VIDEO: Amtrak Sets Its Eyes on the Coveted Millennial Demographic

On the heels of kicking off their new Writers Residency program, where writers can ride intercity passenger rail for free, Amtrak welcomed 30 prominent new media “influencers” on a long-distance train ride from Los Angeles to SXSW in Austin.

The new initiatives are part of a larger effort by Amtrak to connect with a demographic they believe is already open-minded and passionate about intercity train travel.

“There’s a lot of talk about us being the Me Generation or the Do Nothing Generation,” said Charlie Monte Verde, who is a Millennial himself and also Amtrak’s Government Affairs Specialist for the Midwest Region. “The thing we always see about what we do, is that this can be one of those things that we take and run with. That we make our impact on the United States for the rest of our lives in growing this intercity rail network.”

Monte Verde says that the 30 participants had somewhere around 2.5 million followers on social media, and that the group logged their journey by using the #AmtrakLive hashtag.

The major takeaway for many of the participants, however, was the relaxing nature of the ride, and scenic beauty of the trip.

“I think train travel is a bit of a lost art. It was a very amazing thing to do years ago, and it’s still a very amazing thing to do now,” said Matthew Knell, VP of Social and Community Outreach at About.com. “What Amtrak is trying to do with the new generation; with high-speed rail and new technologies and solutions is great.”

Amtrak is currently in the process of upgrading intercity passenger rail service in the Midwest between St. Louis and Chicago and Detroit and Chicago. Segments of those routes are now operating at 110 miles per hour, with additional upgrades underway to bring the entire length of those routes up to higher speeds.

In October 2013, Amtrak officials signed an agreement with the State of Indiana to maintain Hoosier State service, and revisited the idea of improving service between Cincinnati and Chicago.

Categories
Business News Transportation

Data Suggests Peak Vehicle Miles Traveled Was Reached in 2007

Whether it is widening Martin Luther King Drive, adding a new interchange, building a new bridge, or adding additional capacity to existing streets throughout our cities, we always hear of the robust traffic growth that is anticipated. If nothing is done, then our communities would be stuck in gridlock.

But how have these projections actually measured up?

According to data from the Federal Highway Administration (FHWA) and cross examined with data from the U.S. Census Bureau, the traffic growth projections made by departments of transportation all over the country have been wildly off-base for the past decade.

National VMT (Actual) National Per Capita VMT

Since the 1980s, traffic on our roadways, as measured by vehicle miles traveled (VMT), has increased by approximately 2.5% annually. That is until the early 2000s when that trend changed rather abruptly. Since 2007, actual VMT has decreased approximately .3% annually. Meanwhile, per capita VMT has fallen sharply.

Many analysts have noticed the trends, but have been cautious to make any judgments about them due to the fact that the change took place around the same time as the Great Recession. The common thought was that people without jobs drive less. Even though most economists, however, have noticed a rebounding economy over recent years, both actual and per capita VMT continues to decline.

The persistent trends may in fact be the new normal for America as Baby Boomers retire and Millennials and subsequent generations continue their pivot away from personal automobile use. If this is the case, it appears that the United States hit peak VMT in 2007.

The implications pose serious policy questions. Presently, most departments of transportation spend most of their money annually on new capacity projects, while letting existing infrastructure crumble. Some policy makers and organizations, like Smart Growth America and President Obama (D), who first proposed such a program during his 2013 State of the Union Address, have advocated for a shift in this position to a ‘Fix-It-First’ approach.

Time will only tell what future trends will show. But as of now we are experiencing, for the first time in our nation’s history, a constant period of decline in terms of the amount of driving we are doing.