Categories
News Transportation

City of Cincinnati to Implement Safety Improvements for Pedestrians

The City of Cincinnati will be working to improve its pedestrian crossings over the coming years in order to align with recently updated state and federal standards.

The Manual of Uniform Traffic Control Devices (MUTCD) was updated in late 2009 and includes new best practices for pedestrian crosswalk designs.

The old standard accepted the typical parallel lines seen throughout most of the city today, but the new MUTCD calls for what traffic engineers call “continental” crosswalk markings, which feature two-foot-wide yellow or white stripes. The new MUTCD also calls for the implementation of countdown pedestrian signals where the pedestrian change interval is greater than seven seconds.

Traditional Intersection Design at Seventh & Walnut
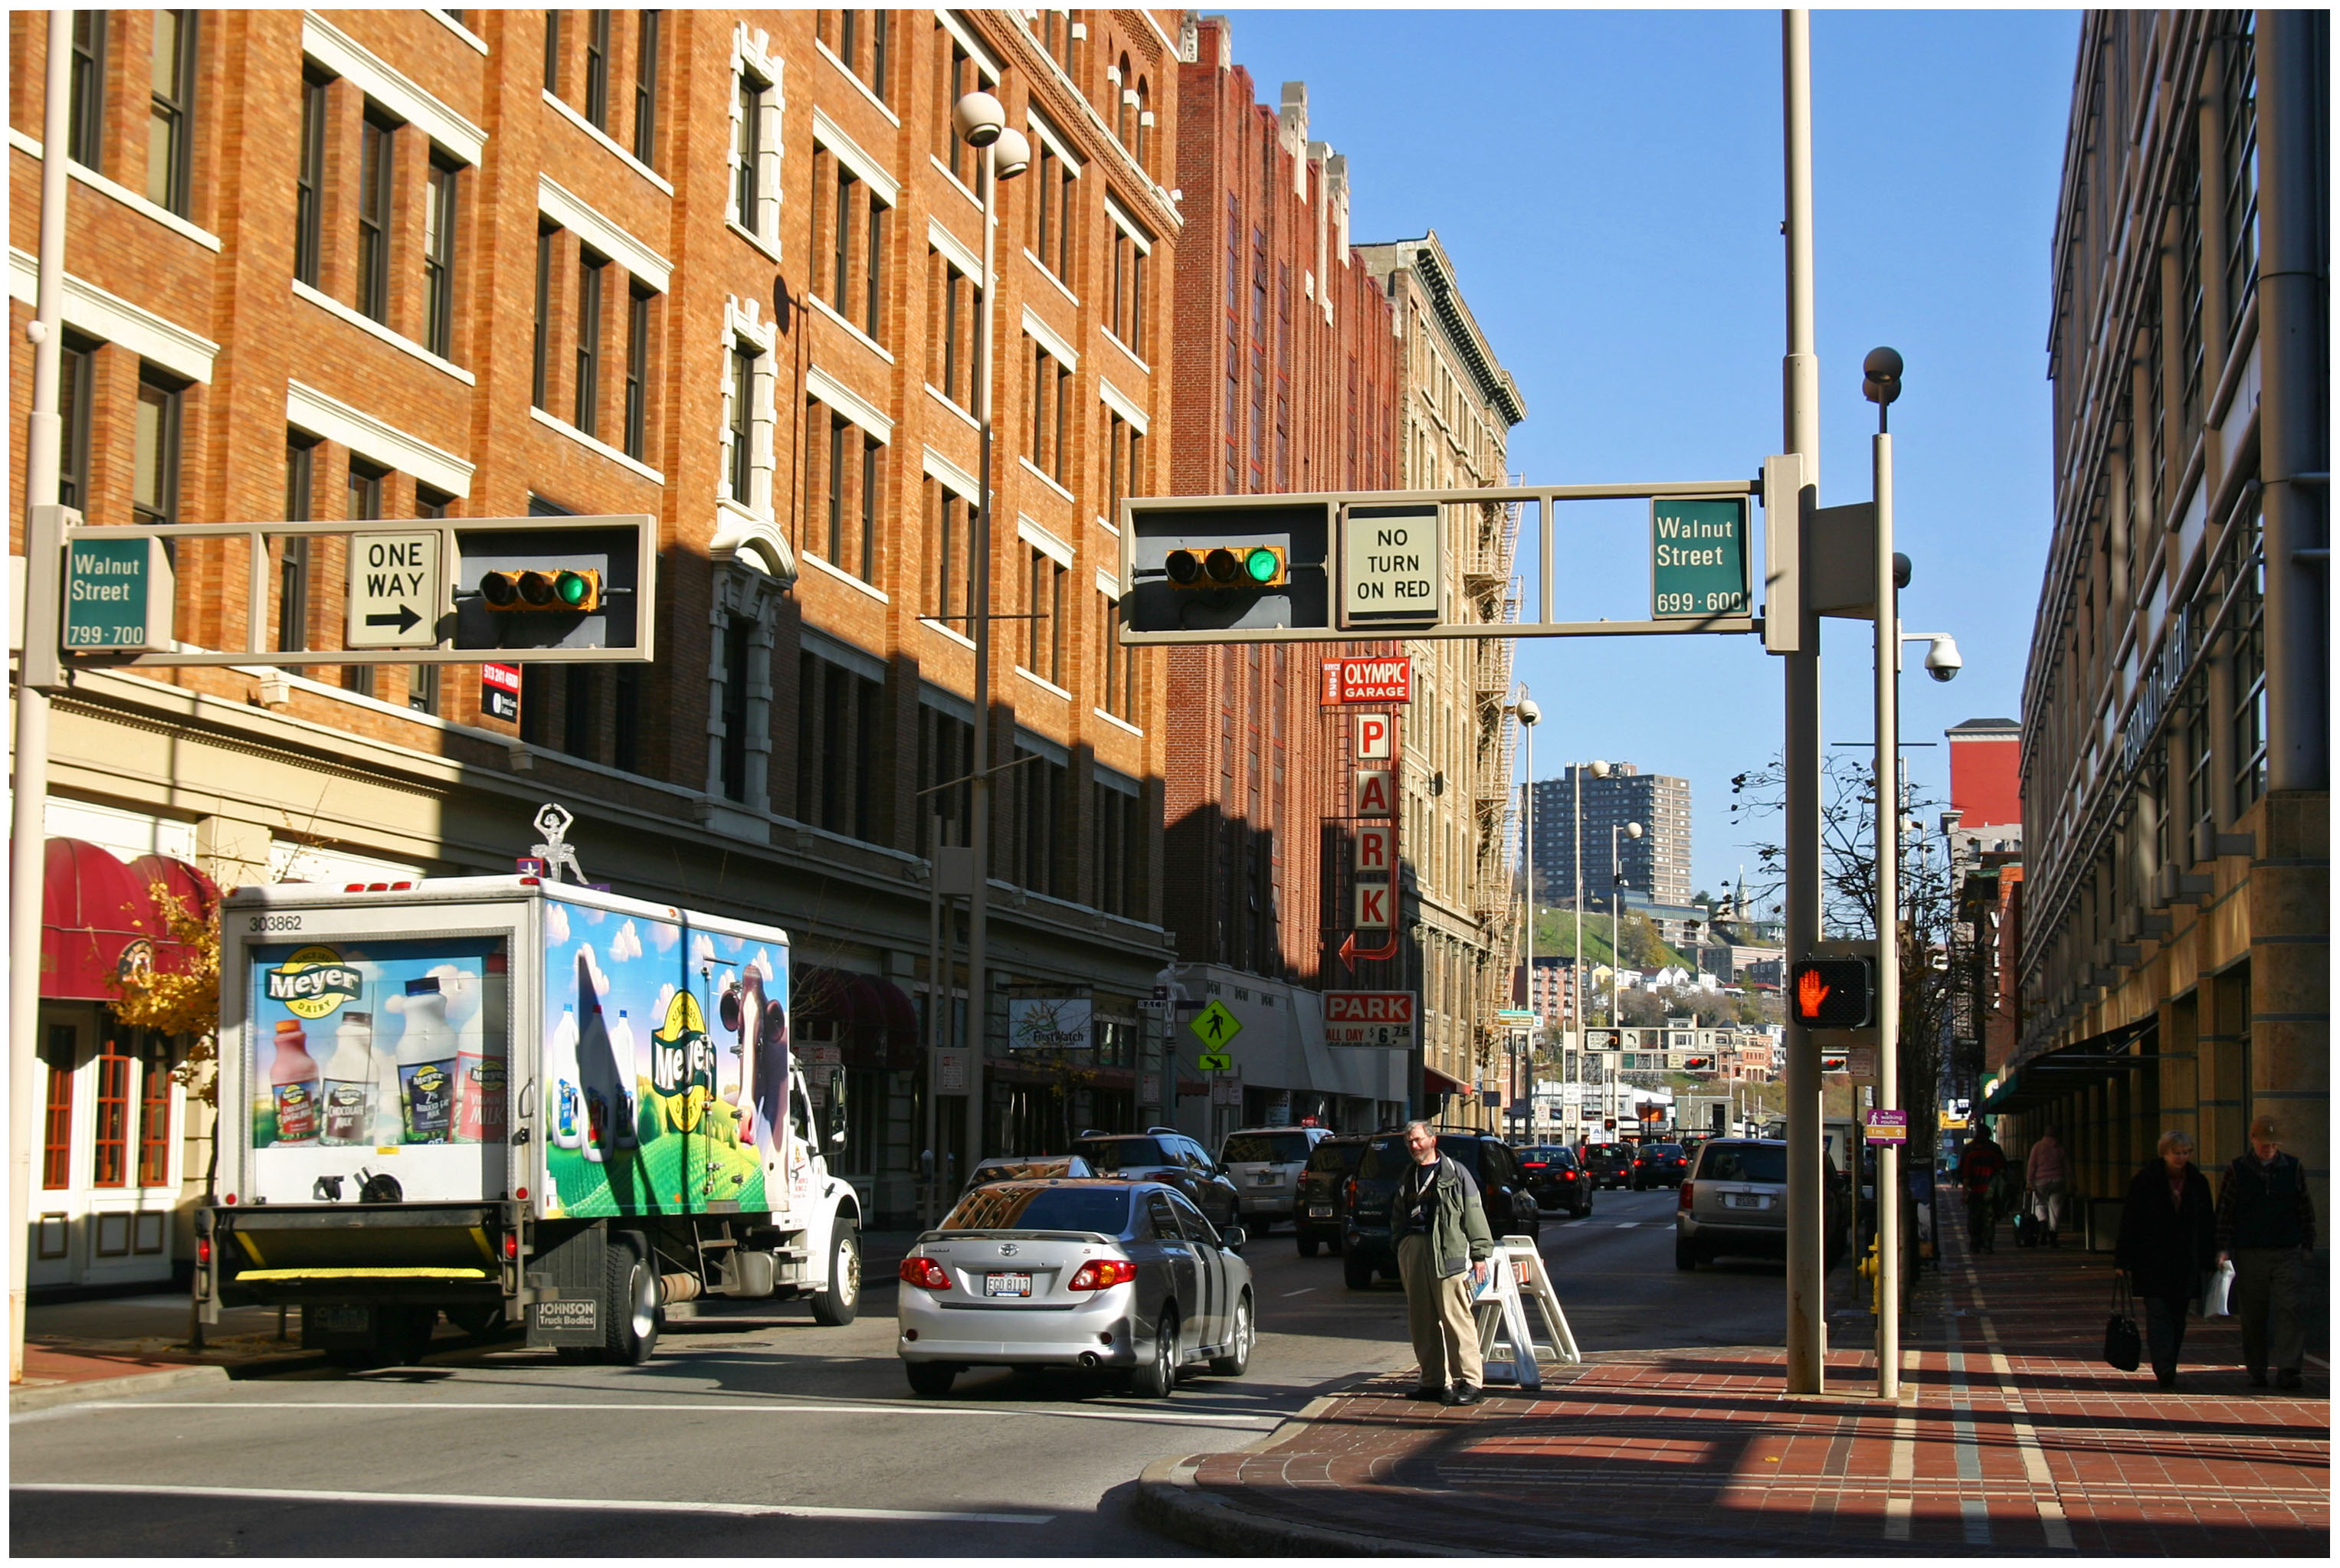
The intersection of Seventh and Walnut Streets downtown represents both the old standard for crosswalk markings and signals. Photograph by Randy Simes for UrbanCincy.

According to Cincinnati’s Department of Transportation & Engineering (DOTE), continental crosswalk markings have not yet been phased in throughout the city, but that as intersections are improved the City is working to upgrade both the pedestrian signals and crosswalk.

“The parallel markings were, at one time, considered “the standard” for crosswalk markings,” Michael Moore, Director of Cincinnati’s DOTE, told UrbanCincy. “However, with the update of the MUTCD in late 2009, best practices established the continental makings as a preferred design.”

The new continental markings are seen as a safety improvement for both pedestrians and drivers as they make crosswalks more visible, thus reducing collisions between automobile drivers and pedestrians.

The new markings, however, do pose some installation and maintenance issues for local governments.

Continental Crossing at Smale Riverfront Park
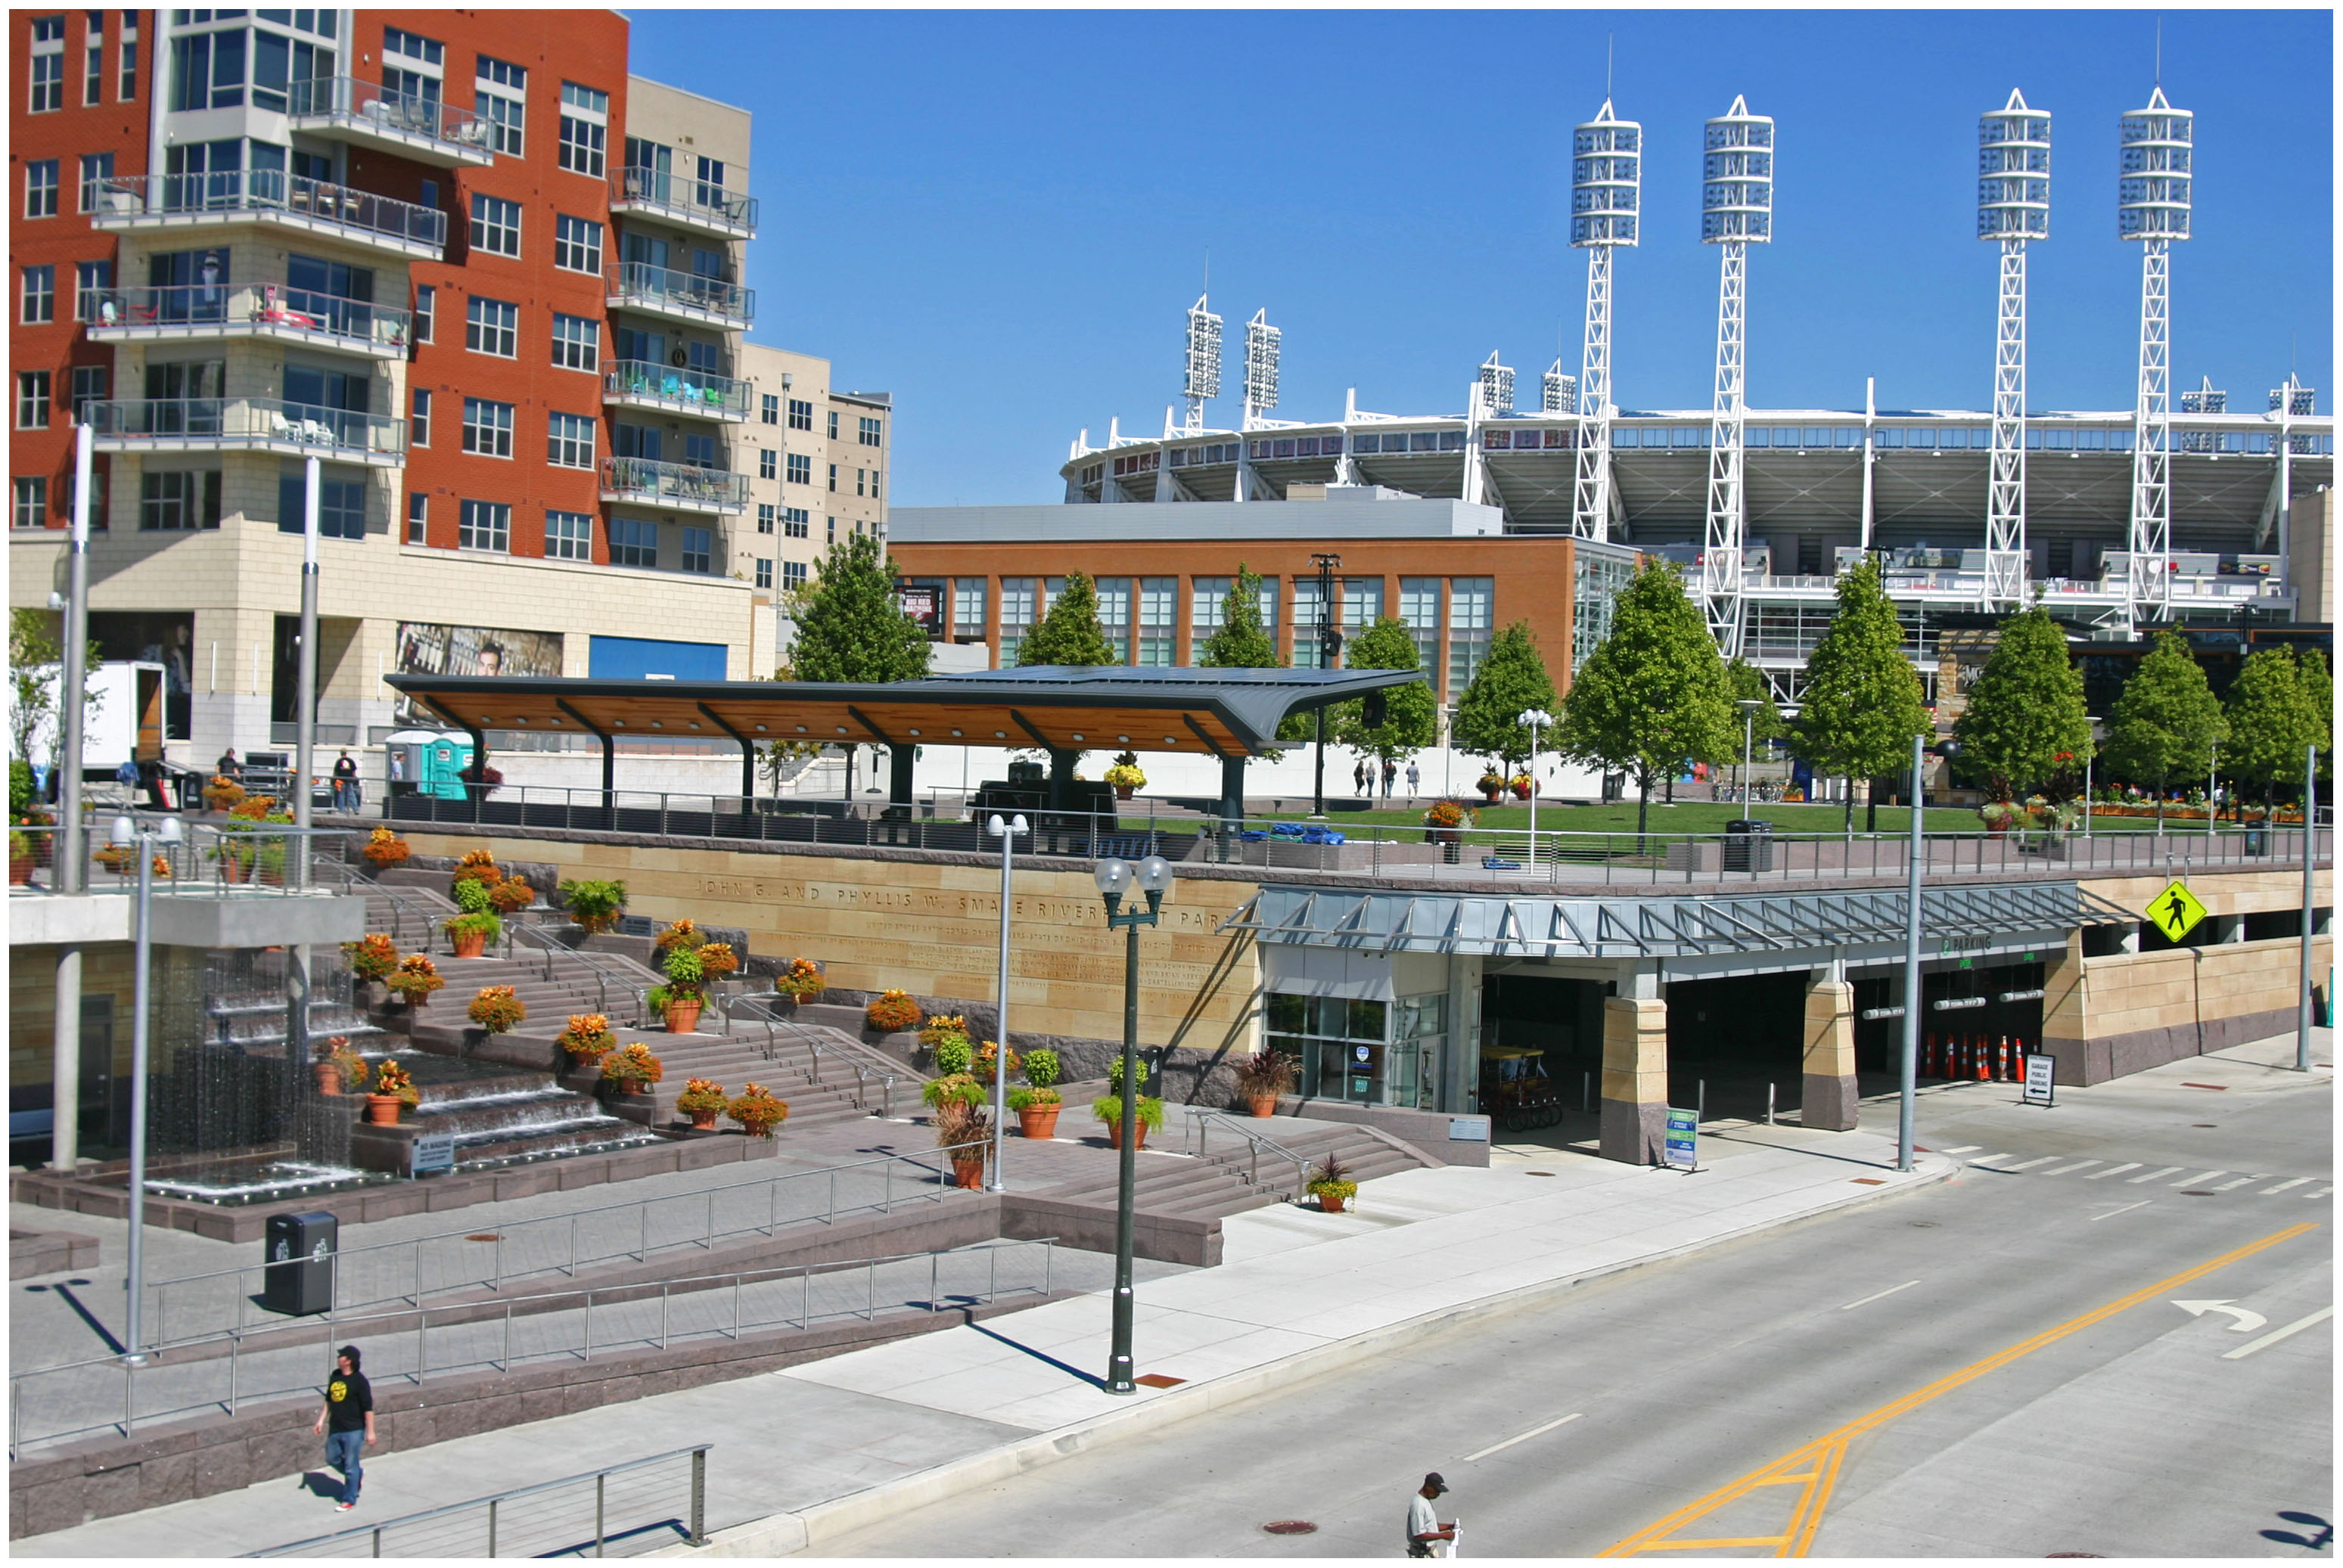
The mid-block crossing, connecting Smale Riverfront Park with The Banks, on Mehring Way features a continental crossing design. Photograph by Randy Simes for UrbanCincy.

“We place most of our markings with thermoplastic because of its durability and reflectivity; however when wet, it can be slippery,” Moore explained. “And because the continental markings require more paint or thermoplastic, they cost more to install, and more to maintain since more of the stripe is in-line with the traffic flow.”

In order to help save taxpayer dollars, Moore says that the City studies where exactly to place the markings so that they avoid the most common path of wheel travel.

Crosswalk signals with countdown timers, meanwhile, have become more popular throughout the United States since cities like Washington D.C. began testing them years ago. Locally, both Covington, KY and Newport, KY have had these timers in use in their downtowns for years.

In addition to these new countdown timers at crosswalks, the time signals allow for pedestrians to cross the street may also soon be changing. Cincinnati officials say they will be adjusting pedestrian signals to accommodate the region’s aging population.

“Where the previous timing assumed pedestrians travel approximately 4 feet per second, the new manual reduces that to 3.5 feet per second,” noted Moore. “It doesn’t sound like a lot, think about the number of large intersections we have.”

There is no set timing on these upgrades, but Cincinnati officials say that more and more crossing signals will be changed out over the coming years, and that crosswalk markings will change as intersection upgrades are performed. Cincinnatians can already see the new continental markings in place a non-signalized, mid-block crossings.

Categories
Up To Speed

Why hyper-local won’t save newspapers (and what will)

Why hyperlocal won’t save newspapers (and what will).

Newspapers have been desperately trying to figure out how to make the finances work as the ground shifts beneath them in an increasingly digital world. In Cincinnati, much like elsewhere throughout the country, local newspapers attempted to compete with bloggers by shifting towards “hyper-local” coverage, but it has yet to work. More from Per Square Mile:

Whenever a business or industry falls on hard times, people trip over themselves to propose turnaround plans. Newspapers are no exception, and I’ll be damned if I’m going to be left out of the fray. My diagnosis? Too many newspapers have placed their bets on intensely local coverage, or hyper-local as they call it in the biz. That’s a mistake. To remain profitable, they need to concentrate on a particular topic instead of a geographic region.

That epiphany occurred to me Christmas morning over a bowl of cereal at my in-laws. I was flipping through the Houston Chronicle when I noticed the paper had branded their energy coverage, FuelFix. Not the best name, but it’s a sound idea. Houston is a major hub for the oil and gas industry, and Chronicle reporters have spent years, even decades reporting on it. Who else would be so positioned to cover the industry?

Categories
Up To Speed

The Best Open Data Releases of 2012

The Best Open Data Releases of 2012.

The year 2012 is over. But it’s important to occasionally look back and see what we did well, and not so well, as a society over the last 12 months. One particular item that has become increasingly more significant in planning our cities is open data. From tracking crime in Philadelphia, bikeshare activity in Boston, transit usage in Atlanta, green roofs in Chicago, to rat sightings in New York City…open data has gone viral. More from The Atlantic on the top 10 open data releases of 2012:

Last year, Atlantic Cities named ten of its favorite metro datasets of 2011 from cities across North America, illustrating the breadth of what we might learn (regarding mosquito traps! misplaced vehicles! energy consumption!) in the still relatively young field of urban open data. For this year’s installment, we’re going one step further. Sure, raw data is great. But useful tools, maps and data visualizations built with said data are even better.

In this story, you’ll find our picks for 2012’s best open data releases from municipal vaults, with an emphasis on tools that can be used by anyone, not just developers and data geeks.

Categories
Up To Speed

The race for America’s fastest broadband speeds

The race for America’s fastest broadband speeds.

Last year Google selected Kansas City as the location for its first attempt to connect homes to its own fiber-optic network. Other than Kansas City, New York City is also trying to ramp up its Internet speeds to compete with cities like Amsterdam, Barcelona, Moscow, Singapore and Toronto. With this Internet speed race in full gear, where does Cincinnati stand? More from Next American City:

Here in Kansas City, Google is in the early stages of an experiment. The stated goal: To learn what there is to know about making high-speed broadband faster, cheaper and ubiquitous. Called Google Fiber, it’s the most ambitious fiber-to-the-home project in the country. Here in the geographic middle of America, at least this moment in time, these paired cities will have the fastest, broadest broadband network in the U.S.

For Kansas City, the dream is of a gigabit of connectivity in every pot, enough to bring into being remote medical screenings, digital coursework from anywhere in the world, fire departments equipped with 3-D building plans and immersive video gaming — enough to transform two mid-sized heartland cities into a 21st-century hub of the digital-age economy, a hotbed of innovation and growth.

Categories
Up To Speed

New iPhone will expose Cincinnati’s lack of open data

New iPhone will expose Cincinnati’s lack of open data.

With the imminent introduction of the next generation iPhone from Apple, the new phone and iOS interface is poised to eliminate Google Maps in favor of Apple’s own mapping software package. The move, which will come by fall of this year, provides driving directions but relies on third-party applications to provide transit directions. The Southwest Ohio Regional Transit Authority (SORTA) is one of the top ten agencies that does not provide the necessary open data necessary to create a transit app to replace Google Maps. More from The Atlantic:

The strategy relies on a pretty big assumption, and third-party developers need open data to build these tools…Many cities still aren’t sharing their data, including big ones like Atlanta, Phoenix, and Detroit. Along with hundreds of other metros, these cities do provide their transit data directly to Google for use in Google Maps, using a standardized format Google developed known as the General Transit Feed Specification (or GTFS). Giving data to Google is not, however, what developers mean when they talk about “open data.”