Categories
News Politics Transportation

Region’s Transportation Funding Disproportionality Favors Cars Over All Other Modes

Research continues to show that Americans are driving less, but are biking, walking and using transit more. This is true in Cincinnati to the extent that transit ridership has increased in recent years.

While originally attributed to the economic downturn at the beginning of the century, these trends have continued while the economy has rebounded – leading many to believe it is an indication of new market forces being driven by aging Baby Boomers and emerging Millennials. Perhaps predictably so, governments have been slow to change with the changing economic forces.

Despite a growing number of trips for biking, walking and transit, funding has not increased correspondingly. In fact, many communities have seen funding for these non-automotive forms of transportation decrease as governments have worked to cut spending at all levels. This, new research finds, is only exacerbating the problem of having underfunded these modes of transportation for many years.

“Conventional statistics tend to under report active travel because most travel surveys under-count shorter trips (those within a traffic analysis zone), off-peak trips, non-work trips, travel by children, and recreational travel,” stated Todd Litman, Executive Director of the Victoria Transport Policy Institute, in a summary of his report entitled Whose Roads? Evaluating Bicyclists’ and Pedestrians’ Right to Use of Public Roadways.

“More comprehensive surveys indicate that active travel is two to four times more common than conventional surveys indicate, so if statistics indicate that only 5% of trips are by active modes, the actual amount is probably 10-20%.”

Litman indicates that funding levels tend to be much lower than even the low 5% trip share estimates, and recommends changing those levels to reflect not only the current trip share levels, but those that could be achieved should investments be made.

Unequal Funding Allocations at Regional Level
At the local level, the same situation of unequal funding allocation exists. In the 2040 Regional Transportation Plan, developed by the OKI Regional Council of Governments, approximately 88% of the nearly $21.5 billion in funding is recommended to go toward roadway projects, just 11% to transit and a mere 0.1% to bicycle and pedestrian improvements.

While the level of investment in transit appears closely aligned with current ridership levels for commute-related trips, it is far below ideal levels for bicycle and pedestrian investments.

“Relatively aggressive pedestrian and cycling improvement programs only cost about 1-4% of the total per capita roadway expenditures, or just 4-10% of general taxes spent on local roadways,” Litman contests. “Since walking and cycling represent about 12% of total trips, and a much larger share of short urban trips, and since most North American communities have under-invested in walking and cycling facilities for the last half-century, much larger investments in walking and cycling facilities can be justified to meet user demands and for fairness sake.”

OKI leadership contends that the organization’s regional planning document does not accurately reflect the level of investment being made in bicycle and pedestrian infrastructure, noting that many of the “roadway projects” in their plan actually include bike and pedestrian elements.

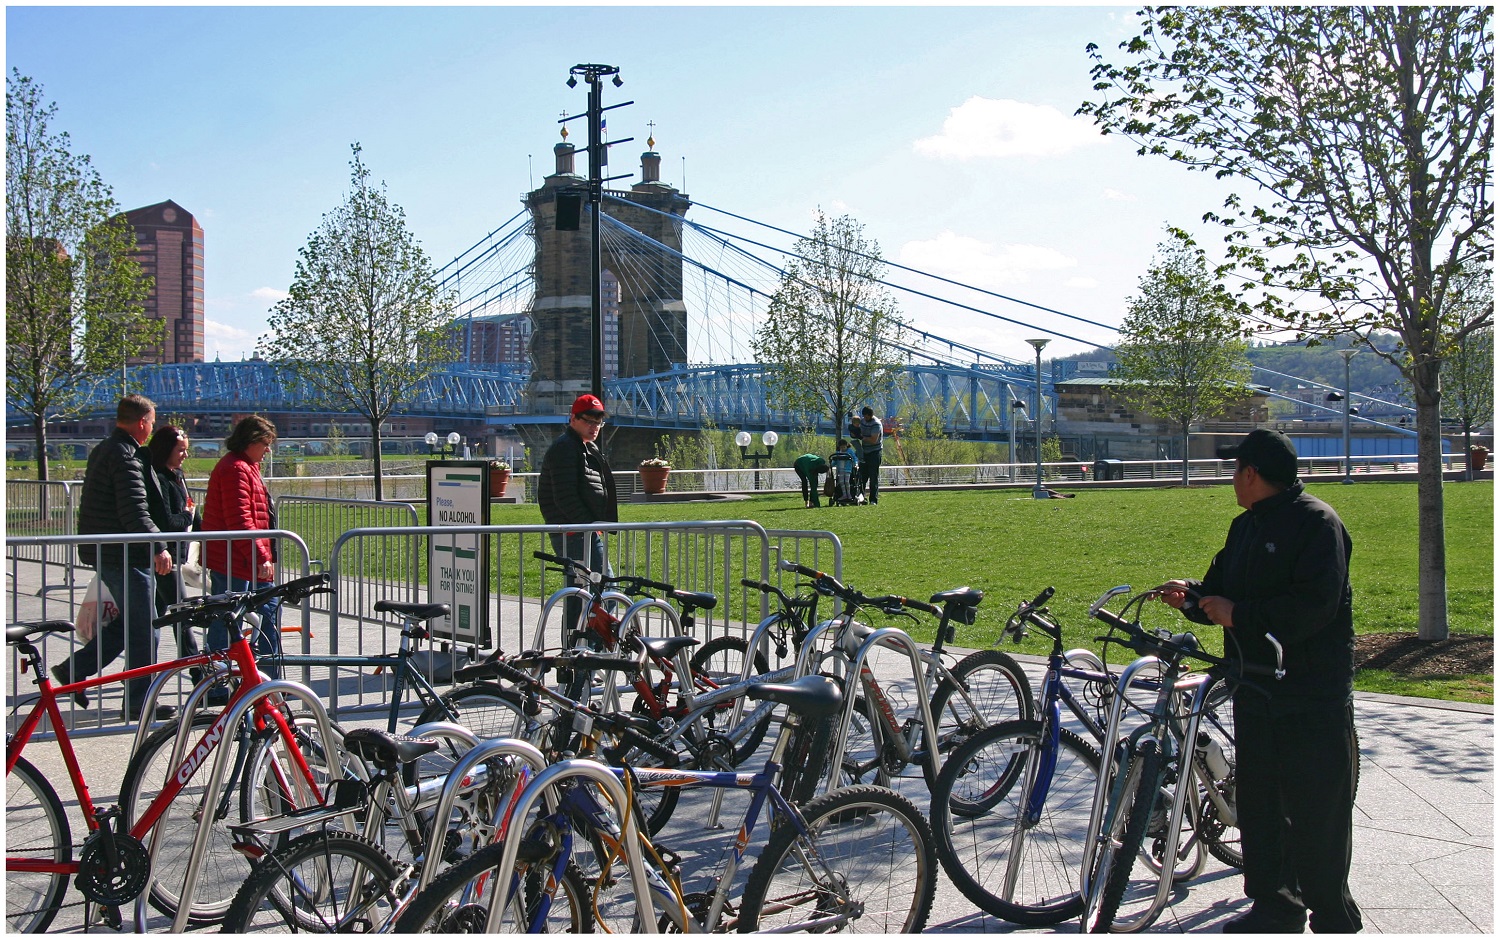
To that end, some recent improvements have been made with regard to bicycle infrastructure. The City of Cincinnati has installed around 40 miles of new on-street bike lanes or paths over the past several years, and has plans to install a total of 290 miles by 2025. The City’s Bicycle Transportation Plan, however, has been plagued by a lack of funding and has been relegated to only moving forward when roadway resurfacing projects emerge.

Not everyone is convinced, however, that enough is being done in terms of the overall investment needed for bike and pedestrian improvements.

Implications for Regional Transit
Of the money being recommended for transit investments, not including operations, approximately 96% is targeted for the contentious Oasis Line – a commuter rail line connecting Cincinnati’s far eastern suburbs with downtown.

Furthermore, the vast majority of OKI’s recommended transit funding is aimed to pay for ongoing operations – not pay for system expansions or improvements.

This grim financial picture for transit gets even worse when considering contributions from state and local governments.

In Ohio, the City of Cincinnati is the only local jurisdiction that provides a dedicated stream of funding for the Southwest Ohio Regional Transit Authority (SORTA), which was also recently found to perform better than average given its low levels of investment from local, regional and state partners.

In Kentucky, meanwhile, communities struggle with state law that prohibits any dedicated source of transit funding – thus forcing the Transit Authority of Northern Kentucky (TANK) to go before the state legislature every year seeking money, similar to how Amtrak must annually go before Congress.

Impact on Environmental Justice Populations
These dire funding and political situations have led to Greater Cincinnati taking the title of being the most populated region in North America without any rail transit; while even far less populated regions advance their own regional transit plans.

What makes the figures more troubling is that those most affected by the imbalanced funding appropriations are minority, low-income and disabled populations. While only 6% of the region takes transit, bikes or walks to work each day, that number escalates to 17% for African Americans, 11% for Hispanics and 10% for people with disabilities; while low-income commuters see that number spike to 21%. Quite simply, the lack of funding for non-automotive forms of transportation is most damaging to those who can least afford it.

The results of this inequality sparked a recent lawsuit by the ACLU of Wisconsin Foundation and Midwest Environmental Advocates filed a complaint against the Wisconsin Department of Transportation over a $2 billion highway interchange project. In MICAH & Black Health Coalition of Wisconsin v. Gottleib, the ACLU states:

“WisDOT explicitly refused to consider transit expansion (or transit in any way) as part of this proposal. This will further widen the already large gap between transit-dependent communities of color and disproportionately white suburban commuters. The ACLU of Wisconsin Foundation was one of the organizations that have complained about the government’s decision-making and reporting process, as well as how the project would exacerbate segregation and disparities in transportation access for low-income people to jobs.”

And while some of these mode shares may seem low, it has been noted by the U.S. National Household Travel Survey that commute trips are the lowest for walking and biking, while personal trips and trips less than one mile are significantly higher for both modes.

“In much of the region where we have large concentrations of EJ populations the sidewalk network is already quite developed, the roadway network is quite developed and available to bicyclists and the transit service is good,” countered Bob Koehler, Deputy Executive Director at OKI. “We do, as a community, need to do a better job at sharing the road and being aware of pedestrians to make these facilities better for all modes.”

Highway Building Frenzy
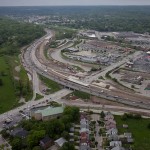
Even though young people are increasingly either delaying or choosing not to get a driver’s license at all, user fees collected from the gas tax continue to decline, total vehicle miles traveled (VMT) has been decreasing since 2007 and annualized VMT has been decreasing for nearly a decade, the nation and Cincinnati region continue to build new capacity.

Of the roughly $8.3 billion being recommended for roadway projects in OKI’s planning documents, approximately 73% of that is targeted for additional lanes, new facilities or new interchanges, while reconstruction and improvements to existing roadways account for the rest.

“Although VMT may be slightly declining in recent years in some parts of the country this may not be a long-term trend. Clearly the region has many needs,” explained Brian Cunningham, Director of Communications at OKI. “This plan addresses the significant existing safety and congestion needs. The plan is updated every four years and will provide an opportunity to revisit the assumptions.”

Litman argues that shifting some of the investment from roadways to bicycle and pedestrian projects due to their proven ability to reduce congestion and improve safety not only for bicyclists and pedestrians, but motorists as well. He also believes that such policy directives empower people by giving them the ability to choose between multiple transportation options for each of their trips.

“It is important to recognize the unique and important roles that active modes [biking and walking] play in an efficient and equitable transportation system, and the various benefits that can result when walking and cycling are improved, including indirect benefits to people who do not currently use those modes,” Litman concluded.

“Just as it would be inefficient to force travelers to walk or bike for trips most efficiently made by motorized modes, it is inefficient and unfair to force travelers to drive for trips most efficiently made by active modes, for example, if children must be chauffeured to local destinations because their communities lack sidewalks, or if people must drive to recreational trails due to inadequate sidewalks and paths near their homes.”

This information comes at a time when the region has been identified as failing to develop walkable urban places, and thus putting itself behind its national competitors.

Categories
Business Development News

Cincinnati Posts Population Gain for Second Consecutive Year

Cincinnati has added about 1,000 new people since the decennial census in 2010, according to new estimates released by the U.S. Census Bureau.

The modest increase comes from two consecutive years of population gains that followed an immediate downward revision after the 2010 Census. The increase also means that just Cincinnati, Columbus and Dayton were the only big cities (more than 50,000 people) in Ohio to post gains.

Columbus and Cincinnati, meanwhile, were the only big cities to post population gains for the past two years.

The population estimates are derived using the 2010 Census as a baseline and then factoring in new permitted residential construction and mobile homes, and subtracting out the estimated number of homes lost each year. As a result, all of the annual estimates should come with a grain of salt.

Ohio Cities Comparison

With that said, Dayton’s population gains appear to be an anomaly, while the increases in Columbus and Cincinnati appear to be more rooted. In any case, the news for Ohio’s big cities is not good as the rest all lost population, especially those in the northeastern part of the state.

Columbus continues to stand out from the rest of Ohio’s big cities in terms of its population trends. In this latest estimate release, Columbus posted the fifteenth largest numeric population gain of any municipality in America; and it comes on the heels of equally impressive gains in prior years.

Some observers, however, would attribute some of the gains in Columbus to its unusually large municipal boundaries that include what would be far suburbs in other Ohio regions.

While Columbus has been growing by about 1.5% annually over the past several years, Cincinnati has been growing annually by about 0.25%.

When compared with other peer cities, Cincinnati’s gains look even more tepid.

Peer Cities Comparison

Of fifteen other cities competitive with Cincinnati, the city bested only five of them in terms of population growth, while being significantly outperformed by most all others. In this comparison, even Ohio’s best performer – Columbus –fares only reasonably well against the field.

For Cincinnati’s peer cities, national trends appear to hold true. Southern cities continue to grow at the fastest clip, but their growth rates are leveling off. In our comparison, Austin, Atlanta and Tampa have all experienced significant declines in annual population growth since the 2010 Census. Charlotte has also experienced a similar trend, but appears to be holding steady more so than its Sun Belt peers.

Meanwhile, while many Midwestern cities continue to lose population, they are doing so at a slower rate or have stopped the losses entirely.

As we previously examined on UrbanCincy, the Cincinnati region continues to grow by about 0.4% annually. The City of Cincinnati’s 2013 gain represents approximately 12.5% of the total regional population growth, and half of Hamilton County’s increase last year.

In a nutshell, Cincinnati is over performing regionally, but under performing amongst its peers. If Cincinnati were growing as fast as Charlotte or Austin, the city would be adding around 9,000 new people every year.

Categories
Business Development News

Townhomes Removed from Development Plan for The Banks

Hamilton County leaders announced last Thursday that they had struck a deal with the Cincinnati Bengals regarding a number of issues pertaining to the county’s stadium contract with the team.

The biggest component of that new agreement is that the Bengals will waive their veto right over the heights of buildings at The Banks. This clause in the stadium deal, signed in 1997, delayed the start of construction of Phase IIA work at The Banks by more than a year, and posed a significant risk to the City of Cincinnati in its efforts to lure General Electric and its new Global Operations Center to the central riverfront.

Now that the agreement is signed, developers of The Banks have announced that they will immediately begin construction on Phase IIA project that will include 291 apartments and 19,000 square feet of retail space.

Should the city succeed in its efforts to land General Electric’s facility at The Banks, it is expected that its new office tower would either be located at the office pad within the Phase I footprint, or more likely on top of the street-level retail adjacent to the apartment midrise at Phase IIA.

The development team believes both sites could accommodate the approximately 400,000 square feet of office space desired by General Electric.

The announcement also brought with it renewed questions about the status of the hotel at Phase I, located immediately across the street from Great American Ball Park. On that note, the developers said that they are still working to sign a hotel operator for the space, and that it is unlikely it will be completed ahead of the 2015 MLB All-Star Game.

That leaves only one element of Phase I of The Banks still in question – the oft-forgotten townhomes lining the Schmidlapp Event Lawn.

When asked about the status of the townhomes, and if their delay in moving forward was related to constructability issues with the adjacent and unbuilt hotel site, Libby Korosec, spokeswoman for The Banks development team, said that there are no longer plans for townhomes at that location.

Korosec went on to say that the future of that particular site has yet to be determined, but that it is possible it could be used as part of the hotel, but that no decisions have been made.

“That site was originally planned to have six to eight townhomes, which is not really an efficient number to go in and build,” Korosec explained. “Not only was it not efficient, but it also wasn’t going to be a very good environment for townhomes with all the in and out traffic nearby.”

Korosec noted that the elimination of townhomes from the Phase I footprint does not mean that townhomes will not be built elsewhere. In fact, she said that the development team believes there are other sites at The Banks that would be better suited for such housing.

Part of the change can also be explained by the housing bubble that burst around the time construction started at the site.

“The market on condos and townhomes turned south just when we signed the MDA,” Korosec said. “However, homeownership via condos is still a strong possibility at The Banks for future phases should the market demand it.”

The development team opted to forgo building condos at $91 million Phase IA of The Banks, and instead built apartments due to the housing downturn. The decision has proved successful as apartments at The Banks fetch some of the highest prices per square foot in the region and have a waiting list of approximately 60 people.

Since that time the MDA was signed, however, the owner-occupied housing market has shown signs of life throughout the center city where there is currently little supply available. Recent developments, led by 3CDC in Over-the-Rhine, have sold quickly and, in some cases, for more than $300 per square foot.

The Banks development has drawn a significant amount of publicity since its first phase opened in 2011, but work is far from over at the massive riverfront project site. As of now, The Banks is only approximately one-third of the way built out.

Categories
Business Development News

Hamilton County Posted Largest Population Gain in Cincinnati MSA in 2013

New population estimates released by the U.S. Census Bureau last week show that Hamilton County’s population slide has ended and that the Cincinnati metropolitan region remains the largest in Ohio, Kentucky and Indiana with more than 2.1 million people.

In 2013 Hamilton County added more than 2,000 new people – making it the biggest gainer in the 15-county tri-state region. Warren County came in a close second with just under 2,000 new people.

Boone and Kenton Counties in Kentucky and Clermont County in Ohio also posted population gains of more than 1,000 people. Meanwhile five rural counties in the region saw their population decline, with Brown County in Ohio losing the most at an estimated 165 people.

The Cincinnati region as a whole is estimated to have added just over 8,000 residents in 2013.

Cincinnati MSA Population Changes 2010-2013

Over the past year, the region also posted gains in terms of international migration, but saw continued losses for domestic migration. Net migration to the Cincinnati region was actually negative, but thanks to births significantly outpacing deaths, the region was able to post its overall population gain.

When compared to Columbus and Cleveland, Cincinnati lags in terms of international migration numbers.

Columbus, meanwhile, is the only region out of the big three in Ohio that posted gains in both international and domestic migration – making it the only metropolitan area in the state to have positive net migration in 2013.

Regionally, Hamilton County was the only county to see more than 1,000 new international migrants. But at the same time, Hamilton County also recorded the largest domestic migration loss of any county in the region.

While most all of Hamilton County’s population gains can be attributed to births exceeding deaths, approximately half of Warren County’s gain can be attributed to its positive net migration over the past year. Aside from Warren County, only four other counties in the region experienced positive net migration.

Ohio Metropolitan Region 2030 Population Projection

The population estimates continue to look bad for Cleveland, which recorded regional population loss once again. Since the 2010 Decennial Census, Cleveland has posted average annual population losses of 0.2%, while Cincinnati and Columbus have posted gains of 0.4% and 1.1% respectively.

Should these trends hold over the coming years, Columbus will follow Cincinnati’s lead and pass Cleveland, once the state’s most populous metropolitan region, in terms of overall population by 2017.

Due to the faster growth taking place in Columbus, it will also eventually catch and pass Cincinnati as the state’s most populous region a decade from now. Cleveland, meanwhile, will see its regional population dip below two million in 15 years.

A long forecasted but yet realized trend appears to be taking hold in the second decade of the new millennium. Instead of cities bleeding population to suburban areas, rural areas are now losing their population to suburban areas while cities hold on to their core population while also continuing to attract international and some domestic migrants from suburban and rural areas.

The Decennial Census in 2010 was a splash of cold water for many cities, including Cincinnati, who had thought that they had already reversed decades of population loss. Perhaps these new trends, now being realized, will finally result in the population gain so many cities have been longing for in 2020.

Categories
Up To Speed

Will Detroit actually demolish 117,000 buildings over the next five years?

Will Detroit actually demolish 117,000 buildings over the next five years?.

At the end of 2012 we sounded the alarm about a new grant from the State of Ohio that would allow for Hamilton County leaders to demolish approximately 700 buildings in the name of blight removal. Well try this on for size: the City of Detroit has proposed increasing its blight removal budget so that it can demolish 400 to 450 buildings a week over the next five years. For those keeping score, that would be anywhere from 104,000 to 117,000 total demolitions. More from The Detroit News:

Orr filed his debt-cutting plan of adjustment last month in U.S. Bankruptcy Court and continues to meet opposition from retirees and other city creditors, but says his main focus is getting Detroit on track for its 700,000 residents.

Orr’s plan calls for the infusion of $1.5 billion into capital improvements over the next decade. Among them is an ambitious plan to target Detroit’s blight that Orr insists is “doable.” Orr dedicated about $520 million to blight removal over the next five years. The funding would ramp up demolitions from 114 a week to between 400 and 450.