New population estimates released by the U.S. Census Bureau last week show that Hamilton County’s population slide has ended and that the Cincinnati metropolitan region remains the largest in Ohio, Kentucky and Indiana with more than 2.1 million people.
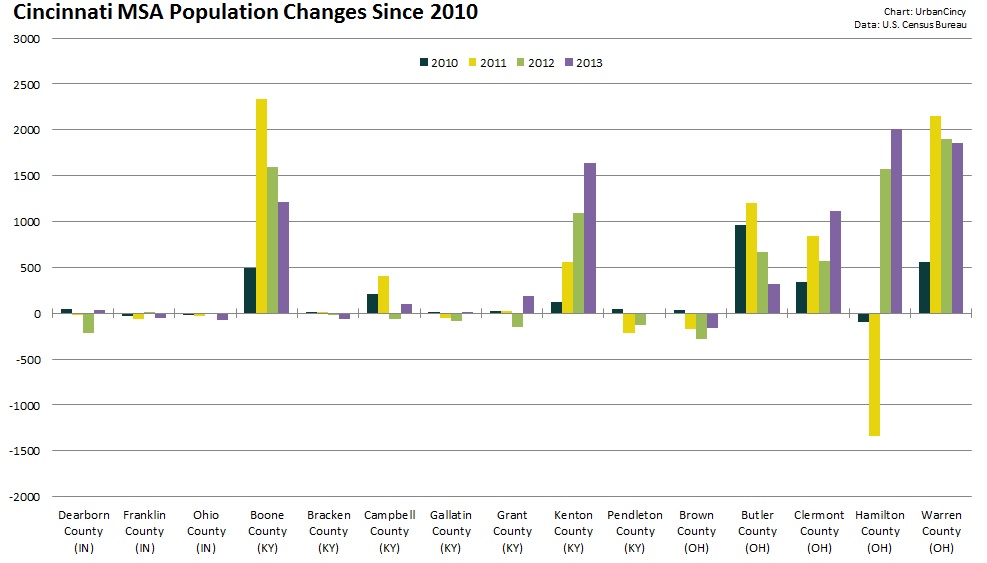
In 2013 Hamilton County added more than 2,000 new people – making it the biggest gainer in the 15-county tri-state region. Warren County came in a close second with just under 2,000 new people.
Boone and Kenton Counties in Kentucky and Clermont County in Ohio also posted population gains of more than 1,000 people. Meanwhile five rural counties in the region saw their population decline, with Brown County in Ohio losing the most at an estimated 165 people.
The Cincinnati region as a whole is estimated to have added just over 8,000 residents in 2013.
Over the past year, the region also posted gains in terms of international migration, but saw continued losses for domestic migration. Net migration to the Cincinnati region was actually negative, but thanks to births significantly outpacing deaths, the region was able to post its overall population gain.
When compared to Columbus and Cleveland, Cincinnati lags in terms of international migration numbers.
Columbus, meanwhile, is the only region out of the big three in Ohio that posted gains in both international and domestic migration – making it the only metropolitan area in the state to have positive net migration in 2013.
Regionally, Hamilton County was the only county to see more than 1,000 new international migrants. But at the same time, Hamilton County also recorded the largest domestic migration loss of any county in the region.
While most all of Hamilton County’s population gains can be attributed to births exceeding deaths, approximately half of Warren County’s gain can be attributed to its positive net migration over the past year. Aside from Warren County, only four other counties in the region experienced positive net migration.
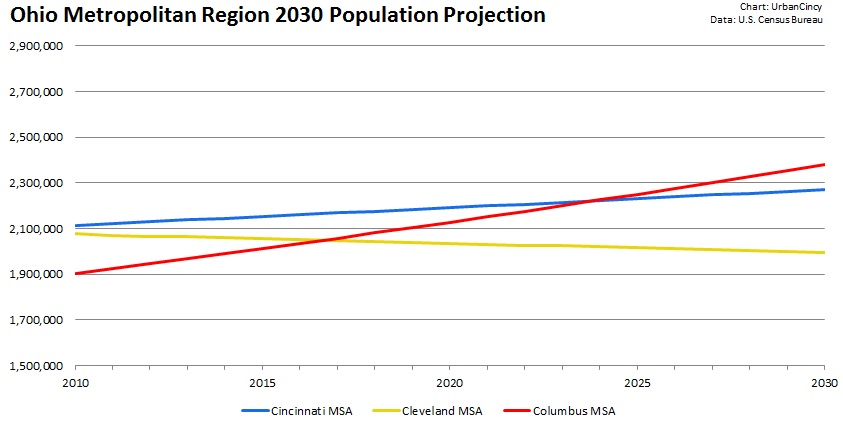
The population estimates continue to look bad for Cleveland, which recorded regional population loss once again. Since the 2010 Decennial Census, Cleveland has posted average annual population losses of 0.2%, while Cincinnati and Columbus have posted gains of 0.4% and 1.1% respectively.
Should these trends hold over the coming years, Columbus will follow Cincinnati’s lead and pass Cleveland, once the state’s most populous metropolitan region, in terms of overall population by 2017.
Due to the faster growth taking place in Columbus, it will also eventually catch and pass Cincinnati as the state’s most populous region a decade from now. Cleveland, meanwhile, will see its regional population dip below two million in 15 years.
A long forecasted but yet realized trend appears to be taking hold in the second decade of the new millennium. Instead of cities bleeding population to suburban areas, rural areas are now losing their population to suburban areas while cities hold on to their core population while also continuing to attract international and some domestic migrants from suburban and rural areas.
The Decennial Census in 2010 was a splash of cold water for many cities, including Cincinnati, who had thought that they had already reversed decades of population loss. Perhaps these new trends, now being realized, will finally result in the population gain so many cities have been longing for in 2020.