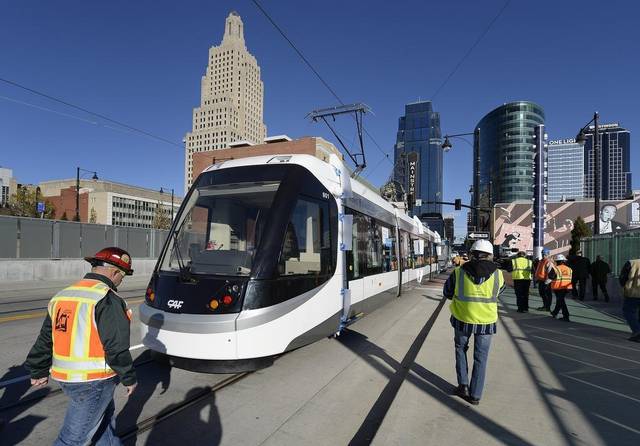
Cincinnati is scheduled to open up its modern streetcar system on September 15, but Kansas City is opening up a system with similar specs today. In fact, they will celebrate the occasion with two days of events aimed at introducing people to the new system.
At 2.2 miles in length, Kansas City has a smaller initial route than Cincinnati’s 3.6-mile system. City leaders there, however, have decided to make the system free to use; and have even made their bus system free during this initial celebration period. In Cincinnati, riders will need to pay $1.00 to ride the streetcar, but there is an ongoing debate about whether there will be an initial period where it will be free.
The opening of Kansas City’s system is particularly interesting due to the fact that the same streetcar vehicles are being used as the ones in Cincinnati. The City of Fountains has also been experiencing a similar explosion of investment on and around its initial $102 million streetcar segment.
“This is my first time visiting Kansas City, and it’s cool to see how much it’s like Cincinnati,” said Derek Bauman, Southwest Ohio director of All Aboard Ohio. “It’s a mid-sized, Midwestern river town; and everything that I’m seeing here coincides with what we’re seeing in Cincinnati – cranes, economic development, new hotels, new condos, new apartments and people moving back into the city.”
Bauman arrived in Kansas City yesterday and will be reporting live for UrbanCincy on our Facebook and Instagram channels over the next few days. He has already posted a number of videos and live reports from Kansas City showing the massive development taking place there, along with the design of their system.
With robust political support in Kansas City, their streetcar has already seen several major sponsors come on board including Sprint, which is the main sponsor and is also providing free wifi on the system, and Blue Cross Blue Shield of Kansas City. Aside from verbal statements, Cincinnati’s corporate community has yet to step up and financially support the system in the same way.
Now that it is open to the public, Kansas City’s streetcar will operate from 6am to 12am Monday through Thursday, 6am to 2am on Fridays, 7am to 2am on Saturdays, and 7am to 10pm on Sundays. It will have 10 minute headways during peak weekday periods, and 12 to 18 minute headways all other times. Transportation officials in Kansas City estimate that the system will serve 2,700 riders per day.
“Like in Cincinnati, there is this buzz of people wanting to be in downtown, and live in walkable neighborhoods,” Bauman explained. “We’ve been talking about this for years, but now we’re seeing it come to fruition in both cities.”
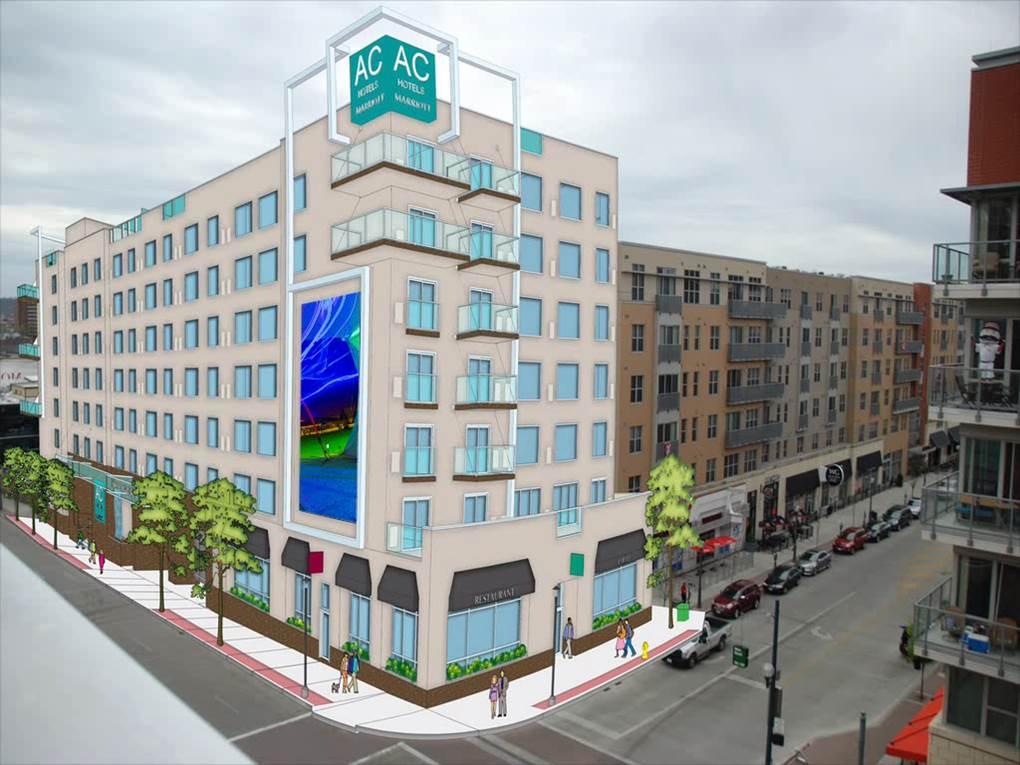
Rendering of the planned 165-room AC Hotel at The Banks [Provided]
After several years of trying to attract a hotel to The Banks, the project has landed a brand that is sure to attract the fastest growing customer segment in the industry – millennials.
In a special meeting before the Joint Banks Steering Committee, Eagle Realty Group development affiliate Main Hospitality Holdings and Blue Ash-based hotel operator Winegardner & Hammons announced plans to build a seven-story, 165-room AC Hotels by Marriott on the southwest corner of Freedom Way and Joe Nuxhall Way, directly across from Great American Ball Park.
The news was broken was UrbanCincy last month and comes one year after the brand backed out of a deal to redevelop the former School for Creative and Performing Arts in Pendleton.
Rendering of the planned 165-room AC Hotel at The Banks [Provided]
Known for its upscale, contemporary European influences, the brand began as a joint venture between Marriott International and leading European hotel developer Antonio Catalán in 2011. The brand officially launched in the North American market in 2013 and now boasts locations in Chicago, Kansas City, Miami Beach, New Orleans, and Washington, DC, making it the fastest launch of a Marriott brand in history.
“We’ve wanted this brand for over five years,” explained Mike Conway, president and CEO of Winegardner & Hammons, with regard to why the third largest hotelier in the world wants to grow in the Cincinnati marketplace. “We think it’s a…absolutely home run in Cincinnati. The reason why we say that is people are moving back to the urban core; and our city, like all major cities across the country, is experiencing a revitalization of downtown.”
Adding to Conway’s enthusiasm was Cincinnati Reds president and CEO, and committee chairman, Bob Castellini.
“The Banks offers up perhaps the best location for a hotel in the city,” Castellini noted. “It took us a while to find and secure the best possible flag and developer for the hotel at The Banks, and I really believe that we have the best possible flag and developer.”
The designs show an L-shaped structure, with the main building height fronting on Joe Nuxhall Way and a smaller, one- to two-story portion to the building’s south.
Along Joe Nuxhall Way, the building will include the front desk and guest rooms – expected to have a $180 per night average rate – and will be capped with a rooftop terrace bar and deck overlooking the Ohio River. It will also include a water feature and a four-story animated LED video board.
The shorter southern portion, made necessary due to height restrictions, will include a lounge, library, fitness facility, conference rooms, and a courtyard overlooking Smale Riverfront Park.
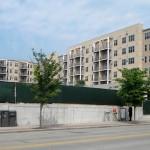
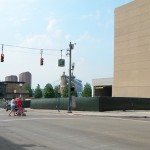
Future Site of AC Hotels by Marriott at The Banks [Kevin LeMaster]
SW Corner of Freedom Way and Joe Nuxhall Way [Kevin LeMaster]
The project team will present the plans to the Urban Design Review Board on Thursday. If all goes according to plan, construction could begin in August and be completed by spring 2017.
The development is expected to cost approximately $35 million, with the equity and debt financing already in place. But the best part, steering committee member Tom Gabelman said, was that it will require no city or county subsidies.
“That’s rather phenomenal in this environment,” he said. “And it’s rather phenomenal, too, that we basically have the quality of hotel that the city and county desired for this premier location.”
Meanwhile, construction continues on Phase 2 of The Banks, most notably on a 339,000-square-foot office building for General Electric that is expected to employ between 1,800 and 2,000 workers when completed in late 2016. Next door, a building featuring 291 apartments and 20,000 square feet of retail space is slated for completion next spring.
Project officials provided some additional details on the infrastructure buildout for Phase 3, which will be paid for with revenues produced by prior phases. This infrastructure work is critical to lift the development out of the Ohio River floodplain, and must be completed before any private real estate development can begin.
Leadership also said that there is a desire to diversify the retail environment along the central riverfront, and further add to the “live, work, play” mantra driving the development.
“I want to add another word there pretty soon, because we hope to have there not just a hotel, but a grocery store and some other retail opportunities so it will be a great place to live, work, shop and play,” said Castellini, who also explained how he used to have to walk down to the river at 4am to make sure it was below 52 feet so that he could open his produce business.
Much has changed along the northern banks of the Ohio River since the days of Castellini’s produce business, and much more will change over the coming years. Project officials say that they will bring a detailed plan for the next round of work to City Council within the next one to two months.
Three percent of the Earth’s surface is developed land, not including farmland. While this may seem like a small percentage, it is the type of development that has created major problems for sustainable living conditions.
With an emphasis on single-family residential developments, auto-oriented planning, and an enormous supply of open land, it has become common knowledge that American cities are more sprawling than their global counterparts. These development patterns, although not entirely confined to the United States, are unique to American planning and have resulted in more sprawl and less sustainable development over the years.
This can plainly be seen by comparing dense European suburbs to American post-WWII sprawling suburbs. Further emphasizing this point today is that while the European Union has identified the percentage of developed land as one of 155 sustainable development indicators in terms of humanity’s ecological footprint, the United States has only noted its land use patterns but not used them as a factor in planning.
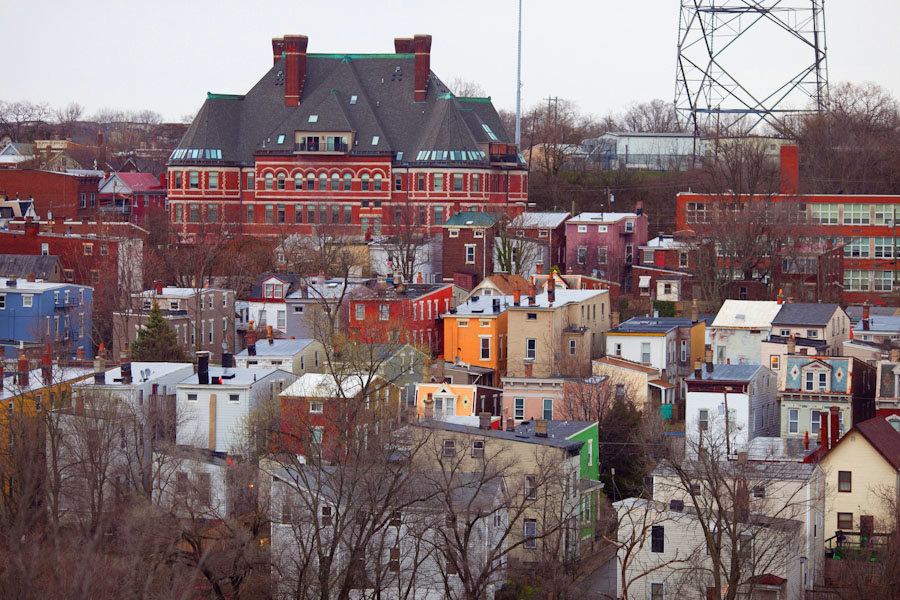
Land Development Sustainability Across America [Provided]
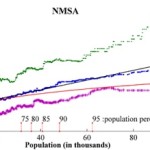
A new study, released in March by environmental engineering professors Dr. Giorgos Mountrakis and Dr. George Grekousis at the SUNY College of Environmental Science & Forestry, confirms the premise that America’s population growth does in fact consistently result in increasing land consumption, with the results varying between different states and counties where land management policies differ.
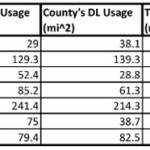
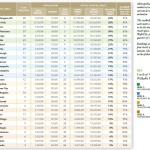
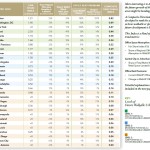
Their study used satellite imagery of the contiguous United States to measure the exact amount of developed land (DL) in 2,909 counties, excluding the outliers in the 100 least populated and 100 most populated counties. They then compared imagery from 2001 to the 2000 Census count in order to rank each county on what they call its DL efficiency. To make for more accurate comparisons, they then compared the results of each given county to the 100 counties closest to it in size (50 smaller and 50 larger).
Using this standard measurement, when Hamilton County was measured it came in at 43rd in its peer group. In this study, those counties with higher scores are considered to be more inefficiently developed. This means that Hamilton County came in slightly ahead of the curve when compared to its peers, which had an average rank of 51.
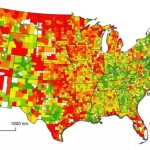
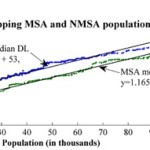
While the study shines a light on population growth and development patterns, it also reveals several socio-economic differences between similarly sized counties. Perhaps the most significant finding was that there seems to be a linear correlation between DL usages and population growth. For example, the researchers found that population growth of a county can be estimated by comparing its current DL usage to its past usage to then produce an estimate within a 95% confidence level. The larger the city gets, the more sprawling it will become at a consistent rate.
The study also confirmed that, compared to other developed countries, the United States is more inefficiently developed and that American cities tend to grow horizontally as population rises instead of vertically.
With this in mind, the report projects that the anticipated 30% population growth, between 2003 and 2030, will result in a 51% increase in land consumption. This equates to 44.5 million acres of land converted to residential and commercial development, and follows a trend of Rural Non-Metropolitan Statistical Areas developing land at nearly twice the rate of urban and suburban Metropolitan Statistical Areas.
One of the commonalities amongst low land consumption MSA counties, the SUNY researchers found, was that they were mostly located in states and cities with stronger planning agencies and urban growth boundaries. Furthermore, nearly all of the cities in these counties also had experienced rapid growth pre-automobile.
With a ranking of 43, Hamilton County comes in slightly better than the national average in its peer group. Elsewhere in Ohio, Clermont County ranked at 20 in its peer group, perhaps due to its makeup of 19th century towns and propensity of farms. And reflecting the dominance of post-war suburban housing, Butler and Warren Counties bring up the back of the pack at 62 and 55, respectively.
The three urban counties in Northern Kentucky, meanwhile, followed the larger trend for Kentucky overall and were found to be very efficient in their land use when compared to their peer groups.
For comparison, the Cincinnati metropolitan region as a whole scored better than those in Seattle, St. Louis, Kansas City, Orlando, Oklahoma City and Charlotte.
When Cincinnati’s population peaked in the mid-1950’s, it had over 500,000 residents within the city limits, while that number stood at just under 300,000 in the 2010 Census. This means that as the urban core continues to revitalize and add population, land that has become underutilized or abandoned will have the potential to be redeveloped, adding to the city and county’s density, and thus further improving its ranking.
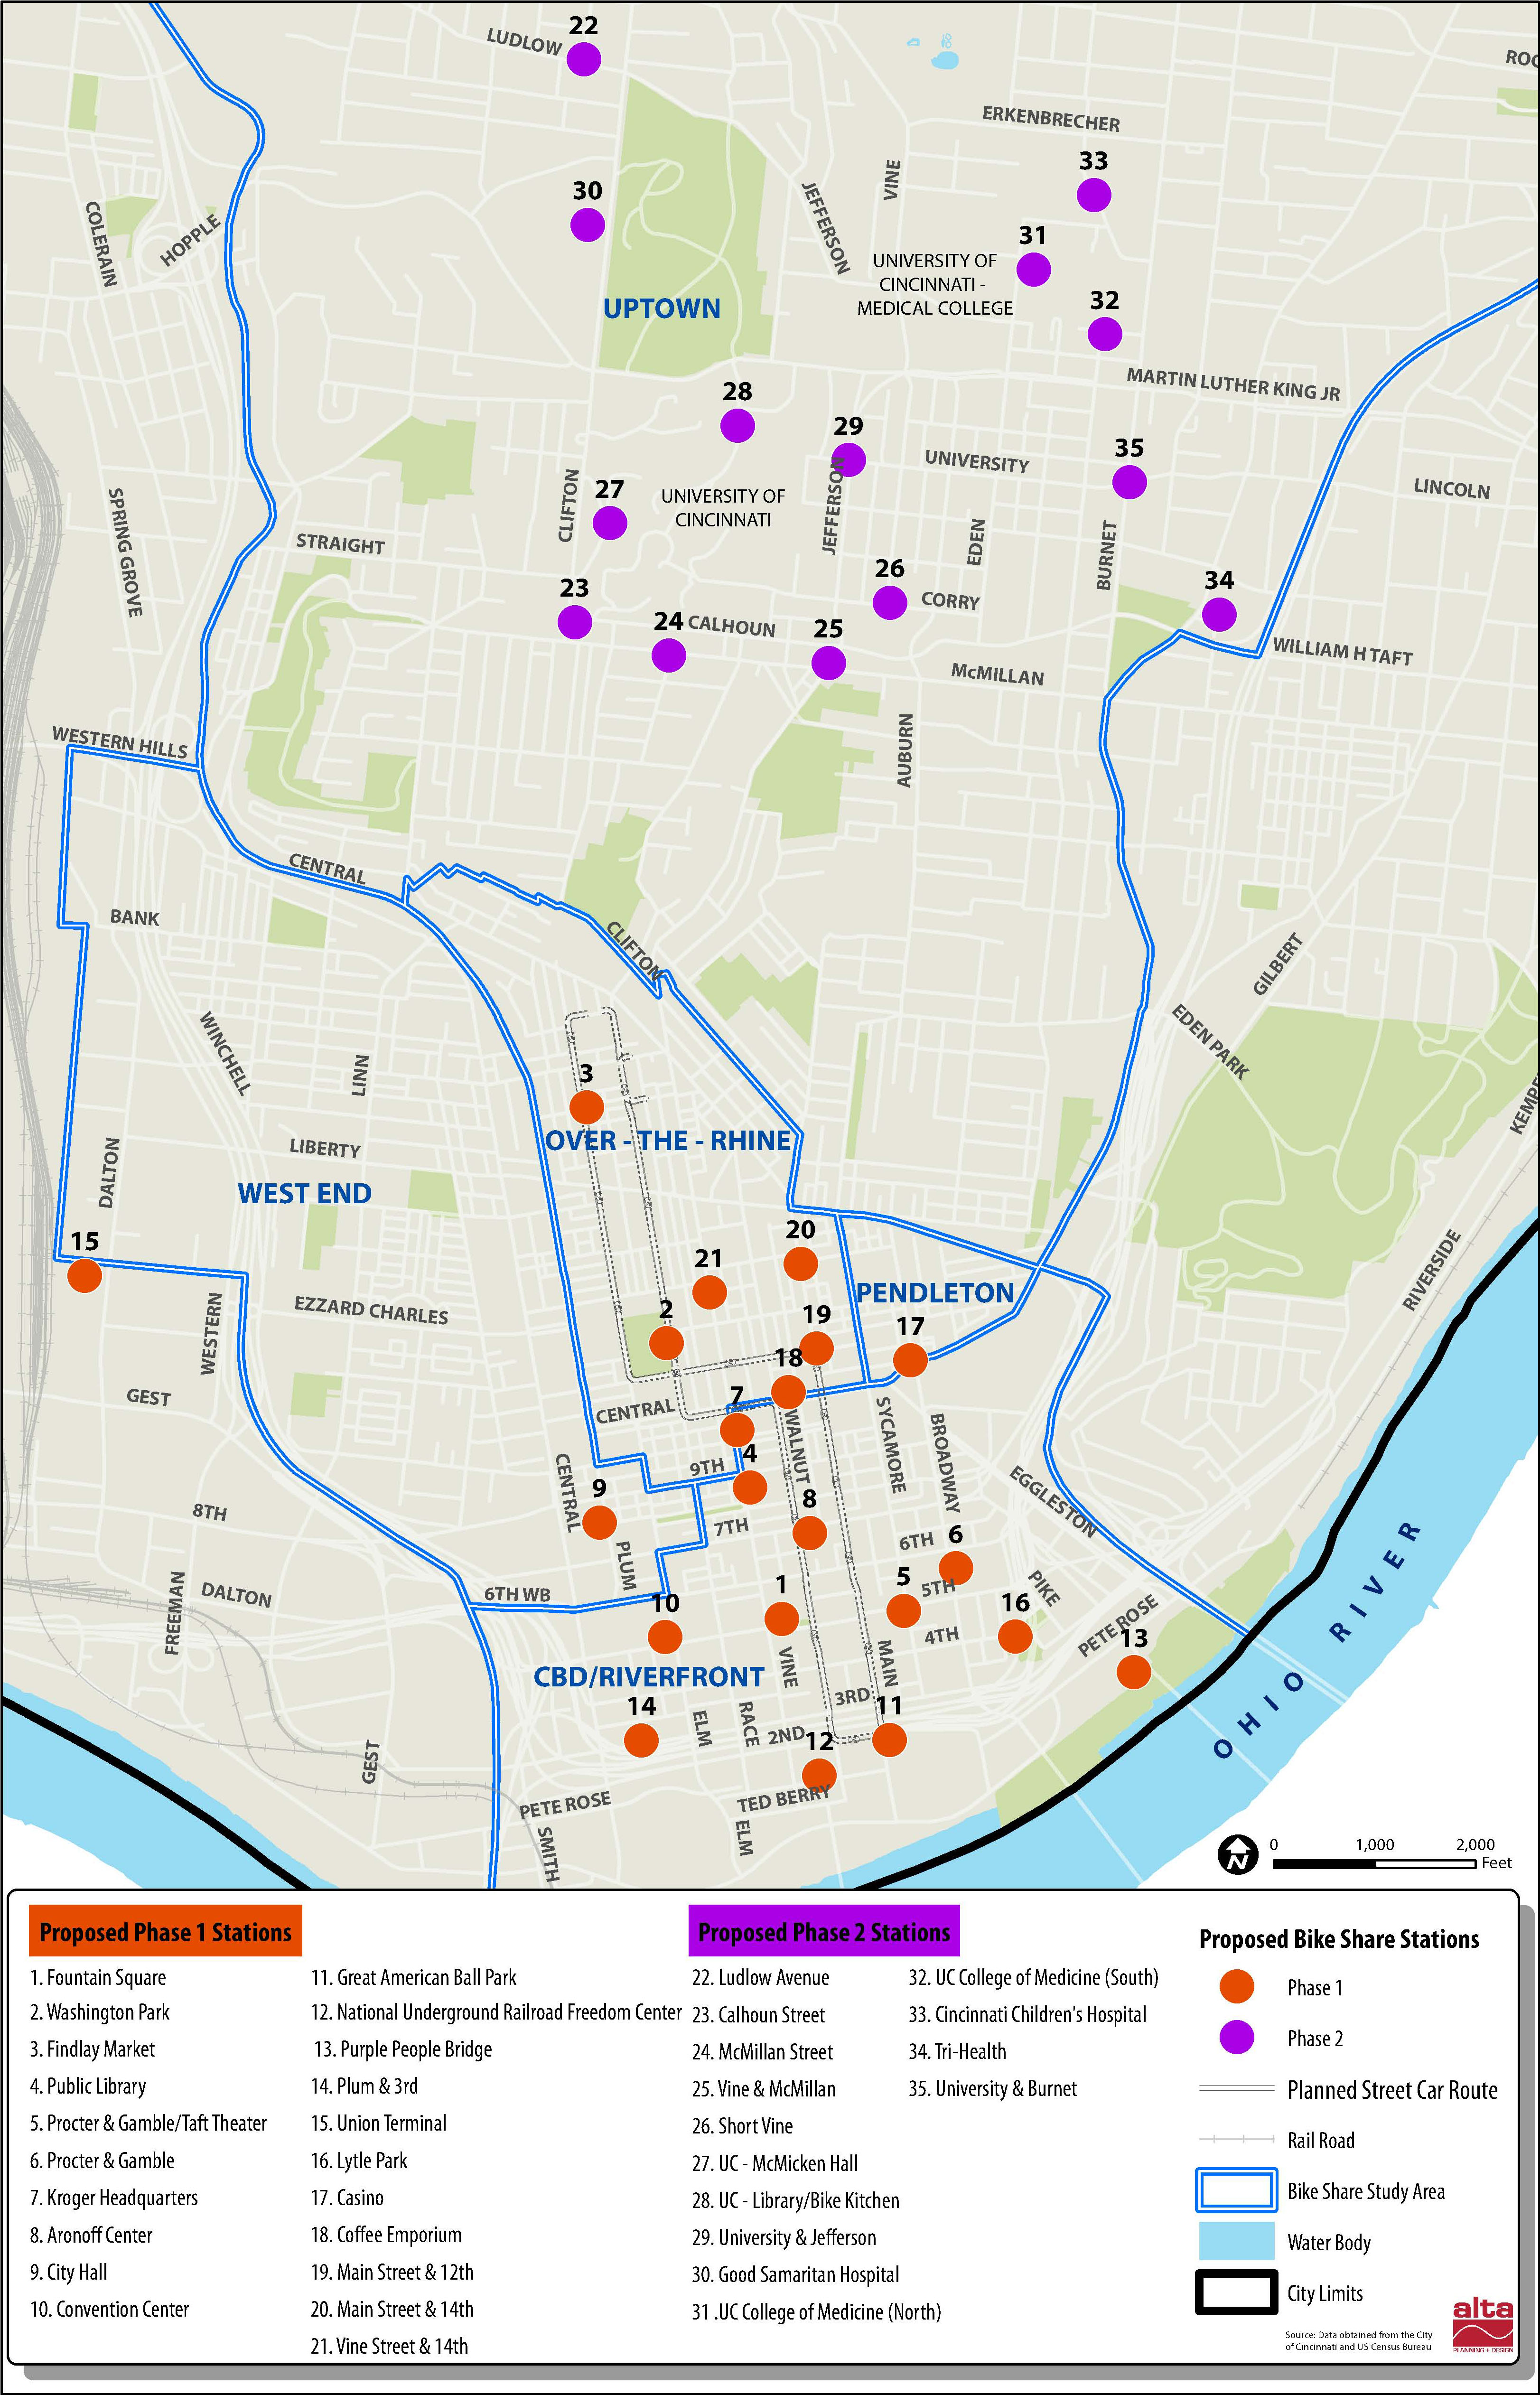
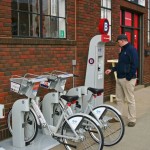
Cincinnati city officials and community leaders are expected to gather at Fountain Square Tuesday morning to unveil the first of Cincy Bike Share’s 35 stations. The ceremony will mark the official start to construction of Ohio’s second and largest bike share system.
Queen City Bike says that the process will move quickly, with two to three stations being installed daily until all 35 stations planned for Downtown and Uptown are built. At the same time, there will be a volunteer effort to assemble the system’s 300 bikes.
“We hope to assemble at least 200 bike share bikes by Friday,” said Frank Henson, President of Queen City Bike, and member of Cincy Bike Share’s Board of Trustees. “This is being done by area volunteer mechanics under the supervision of B-Cycle.”
The aggressive schedule puts the system on track to open by early September, which is not far off the initial goal of opening by August.
The progress comes after Cincinnati Mayor John Cranley (D) announced $1.1 million to more than half of the initial $2 million in upfront capital costs. At the time, Cincy Bike Share director, Jason Barron, said the commitment from the City of Cincinnati was critical in not only getting things moving, but also showing the private sector that it is all for real.
“The mayor’s commitment makes the project a true public private partnership,” Barron told UrbanCincy in April. “The City’s commitment is important to the private funders we have been speaking to, and I believe that it will unlock the last bit of funds that we need.”
Bike share systems have been growing in popularity in North America over recent years. While the most notable are Washington D.C.’s Capital Bikeshare, Chicago’s Divvy and New York City’s Citi Bike, there are now dozens of other cities operating similar systems. The large number and established time period of operations now has given planners a chance to examine empirical data to see what works best.
The more complexities you add to a mode of transportation’s functionality, the less likely someone is to choose that given mode for their trip. This is something that is true across all modes of transportation. As a result, the station density and space contingency calculations have proven to be consistent indicators for a bike share system’s success or failure.
Studies have found that a higher station density is better, and that a target should be approximately 28 stations per square mile. For a city like Cincinnati, that averages out to be a station every couple of blocks. However, the number and placement of Cincy Bike Share stations will be much lower than this target.
When examining of each of the 35 station locations, the system’s station density can be calculated in two different ways. The first would look at just the immediate area in which the stations are located. The second would look at the intended service area for those stations. Naturally, the latter is a bit more subjective.
Divvy Bike Share [Randy Simes]
Kansas City B-Cycle [Randy Simes]
Taipei Bike Share [Randy Simes]
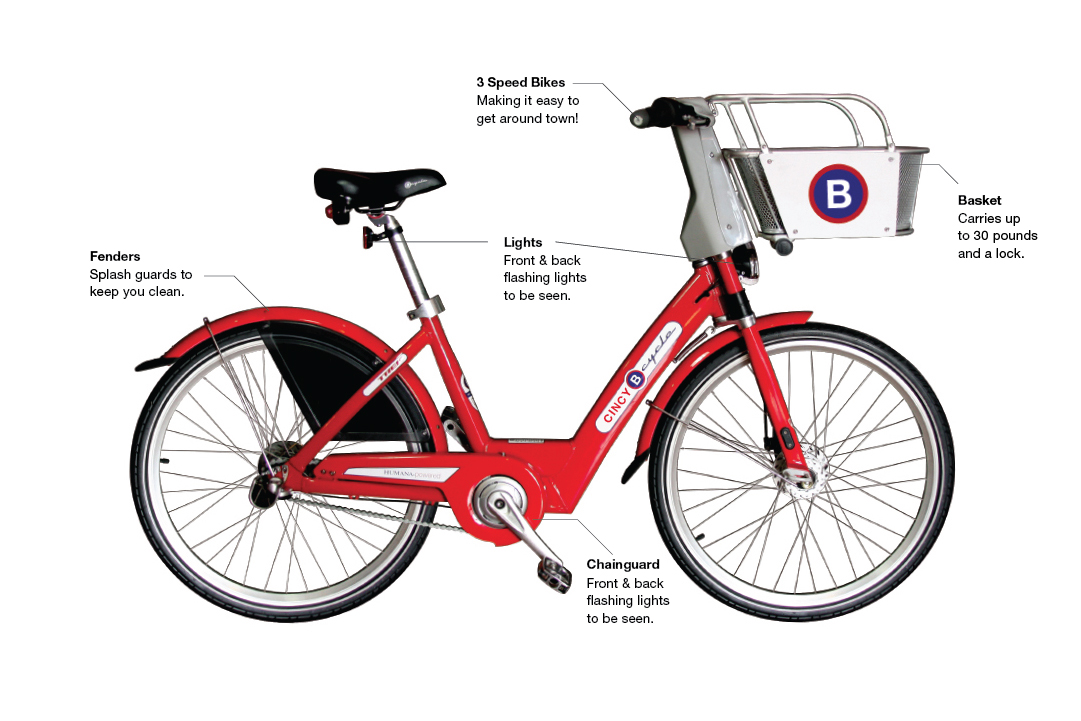
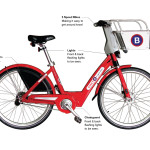
Cincy Bike Share Bike [Provided]
In the case of the first scenario, the Downtown/OTR portion of the system would have approximately 15 stations per square mile, while the Uptown portion would have 10. Overall, the system in its entirety would average out to a respectable 13 stations per square mile.
But under the more second scenario that factors for intended service area these numbers drop. In this case, Downtown/OTR would fall to 12 stations per square mile, and Uptown would plummet approximately four stations per square mile. Overall, the system total would average out to be nearly stations per square mile.
It is important to note that neither of these scenarios includes the Union Terminal station in its calculation since it is an outlier and would clearly skew the results. Furthermore, Downtown/OTR and Uptown were separated in their calculations since many planners and observers concede that the two areas will most likely operate in isolation of one another.
The point is to ensure that there are consistently stations within a short distance of one another so that if one station is full or empty, another station is close by for the potential user. If that user encounters such a situation, however, it is most likely that the potential user will avoid using bike share altogether and instead opt for a different mode.
One of the ways this can be combatted is through the use of real-time tracking technology that allows users to see exactly how many bikes or stalls are available at any station at any given time. This, of course, only aids those with access to data plans on compatible smart phones, and those who think to use it.
In order to fix the problem of full or empty stations, system operators perform ‘bike balancing’ which moves excess bikes from one station to another that is low on bikes. This balancing act proves to be one of the most costly elements of operating a bike share system. In Chicago and bigger cities they utilize small vans to move the bikes around. But in Salt Lake City, where their GREENBike system is quite small, they utilize trailers hitched to the back of other bikes.
As a result of this complex balancing act, and potential barrier to users, another key element of bike share systems is a space contingency at each station. What this means is that if a station has a capacity for 10 bikes, it should not be stocked with 10 bikes. Instead, data suggests that about a 50% space contingency is ideal.
In Cincinnati’s case, Cincy Bike Share will have enough bikes for there to be roughly nine docked at each of the system’s 35 stations. If the system were to fall in line with this 50% space contingency, which would mean that an additional four to five stalls should be available at any given time, meaning each station should have a total of 13-14 stalls. This, however, is not the case.
Cincinnati’s typical station will have 10 stalls, and thus only have a 10% space contingency. Cincy Bike Share officials have not yet commented as to how this will be mitigated, but a potential solution would be simply to not deploy all 300 bikes at once – something that seems reasonable since bikes will need to rotate in and out for repairs. In this case, a more appropriate number of bikes to be in use at any given time might be 240.
Cincinnati’s bikes are expected to be available for use 24 hours a day, and will most likely be available for use year-round. Cincy Bike Share will be responsible for setting the rate structure, which is not final yet, but annual memberships are pegged at $75 to $85 and daily passes between $6 to $8.
Uptown was originally envisioned as a second phase to the system; but now that it is being included in the initial rollout, it leaves an expansion to Northern Kentucky as the next logical choice.
More details are expected to be announced at the press event later in the week.
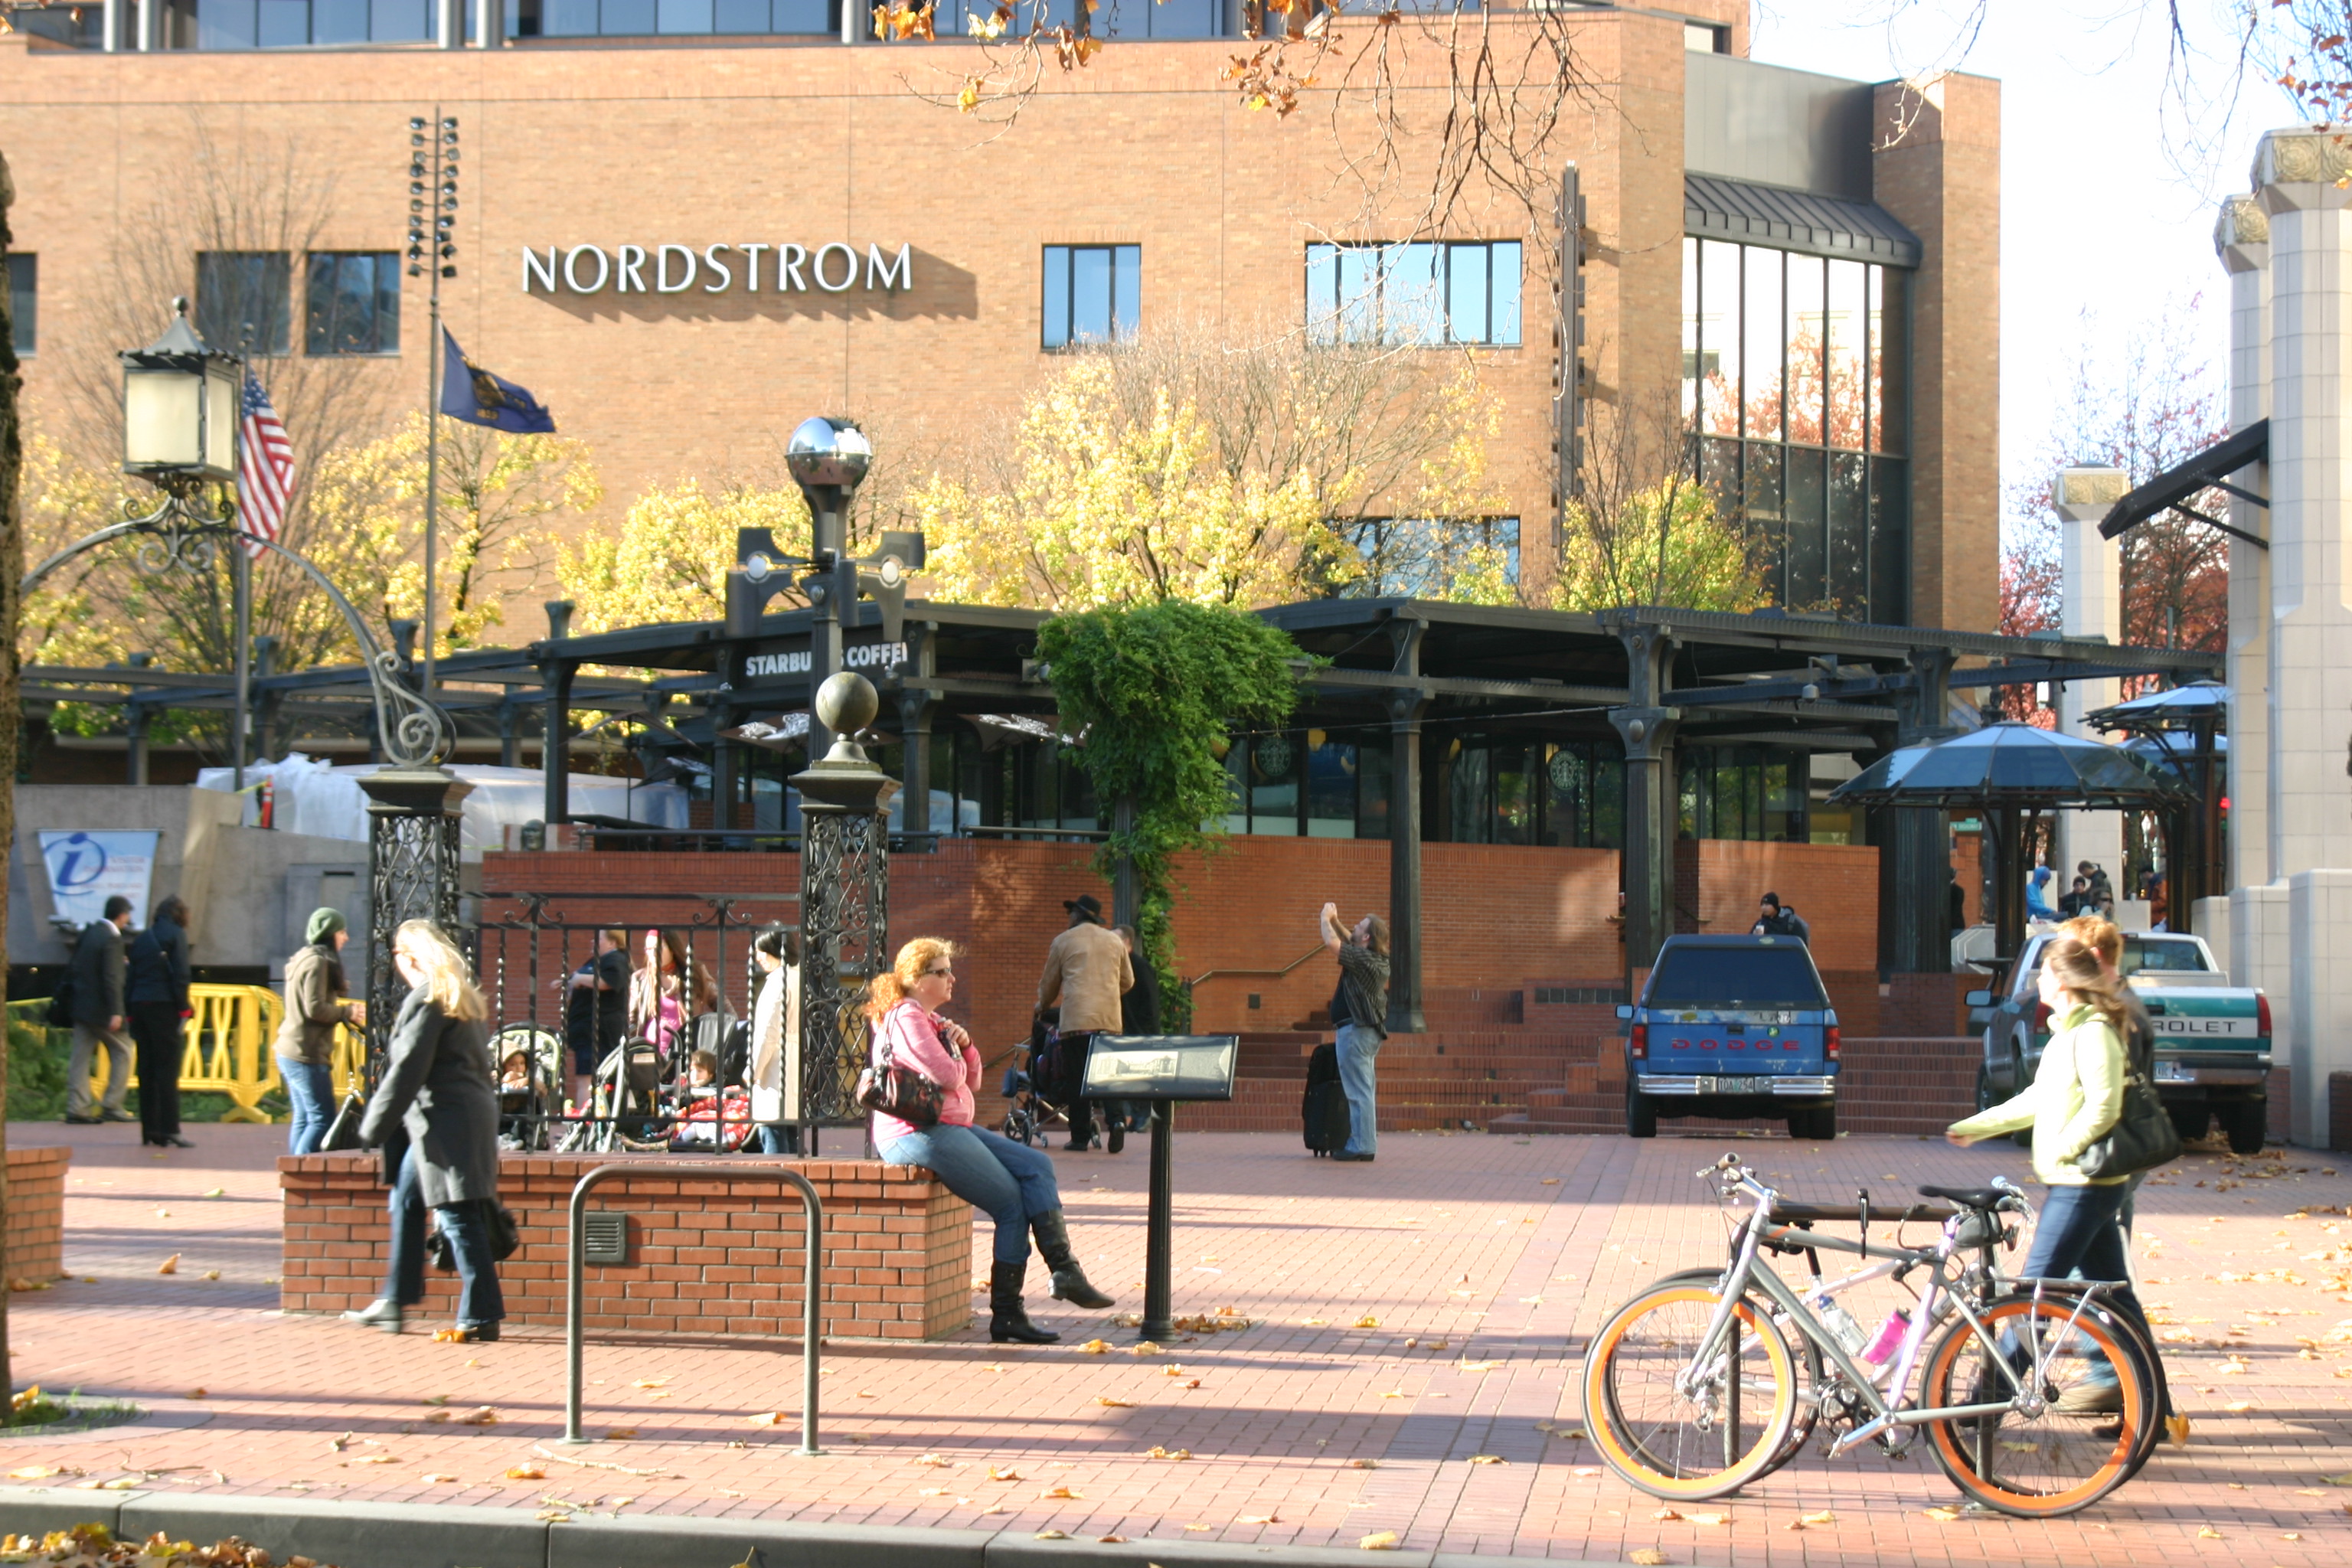
A recently released report conducted by The George Washington University’s Center for Real Estate & Urban Analysis in conjunction with LOCUS: Responsible Real Estate Developers and Investors, a coalition of Smart Growth America gave the Cincinnati region low marks for its walkability and growth patterns overall.
The idea is that developers, investors, government regulators and financiers understood the model that successfully built America’s suburbs during the second half of the 20th century, but that a new model is needed with that era now behind us.
“Over the next generation, walkable urban development will spur even greater economic growth as demand for walkable urban development is met. The future growth of walkable urban places could provide the same economic base in the 21st century that drivable sub-urbanism did in the mid- to late-20th century. However, this growth will not be realized without appropriate infrastructure, zoning, and financing mechanisms at the federal, state, and local levels.”
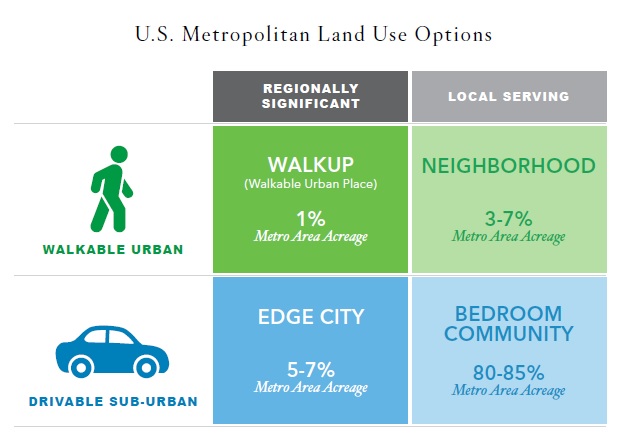
Therefore, the authors of the report, in coordination with a Brookings Institution methodology developed in 2012, defined two primary forms of land use: drivable sub-urban and walkable urban. They also defined the two primary economic functions of those forms as being either regionally significant or local-serving.
Of the four potential combinations of these forms and functions, Foot Traffic Ahead focused on the regionally significant walkable urban places (WalkUPs) in each of the nation’s 30 largest metropolitan regions. When considering all of this, the authors of the report identified 558 WalkUPs nationwide, with 66 of those located in the New York City metropolitan area alone.
Out of the 30 regions studied, Cincinnati was ranked 20th with seven total WalkUPs in the region. Those seven WalkUPs, the report found, contained 33,234,000 square feet of office and retail space, or approximately 15% of the region’s total.
When compared with other regions, an astonishing 100% of the office and retail space located within WalkUPs were within the central city. What this means is that while Cincinnati’s urban core is extremely walkable, virtually nothing outside of it is. As a result, Cincinnati fell at the low end of the six regions classified as ‘Tentative Walkable Urbanism’.
“Four of these six metros – Houston, Columbus, Kansas City and Cincinnati – have 93% or more of their walkable urban office and retail space in the central city; virtually no walkable urbanism exists in their suburbs,” the report noted. “These four metros continued the expansion of drivable sub-urban development patterns.”
It is worth repeating that the methodology of this analysis places a priority on regionally significant places that contain at least 1.4 million square feet of office space, 340,000 square feet of retail space and a Walk Score value of at least 70 points throughout 100% of its area.
Such requirements penalize smaller and mid-size metropolitan regions that have less of this space overall. Perhaps illustrating this is the fact that while Cincinnati ranks 20th overall in this ranking, it comes in at 15th overall in terms of its number of WalkUPs per capita. Had the threshold for defining WalkUPs been lower, then perhaps more areas could have been considered into the overall WalkUP calculations for the region, and thus included smaller hubs outside of the central city.
When compared with the other regions, the future looks even grimmer for Cincinnati. In that ranking, Cincinnati falls five spots and into the category of ‘Low Potential for Future Walkable Urbanism’.
As is true with the existing rankings, the future rankings place a high significance on high volumes of real estate development. With regional growth rates hovering around 0.4%, it offers little opportunity for a region like Cincinnati to make dramatic changes to its development footprint.
However, when compared with the other regions, Cincinnati also appears to be lagging in terms of developing a robust regional transit system with both bus and rail, and lacks regional coordination on developing walkable urban developments. The report did however note that Cincinnati’s streetcar system currently under-construction serves as a bright spot that alone may shift the region from the ‘Low’ to ‘Moderate Potential’ category.
“These 13 metropolitan areas continue to lose market share in office and retail locating in their WalkUPs, continuing the mid- to late-20th century trend toward drivable sub-urbanism,” the report concluded about the regions with low potential in their future rankings.
“In addition, they do not have substantial office rental price premiums. With 5% to 13% of office and retail space in WalkUPs, these metro areas have a long way to go to fully develop walkable urbanism.”
The real interest in the report, however, comes with its overall findings and correlations, as that is where the dire future outcomes may lie for the Cincinnati region.
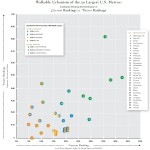
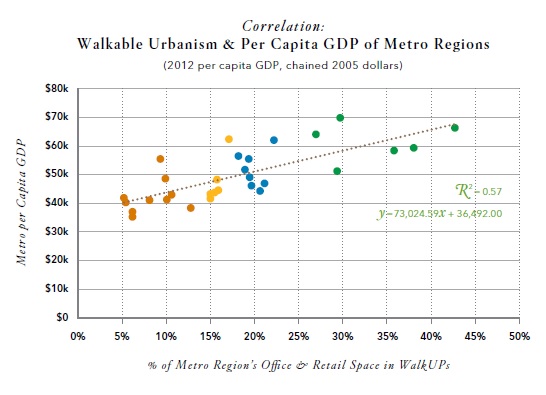
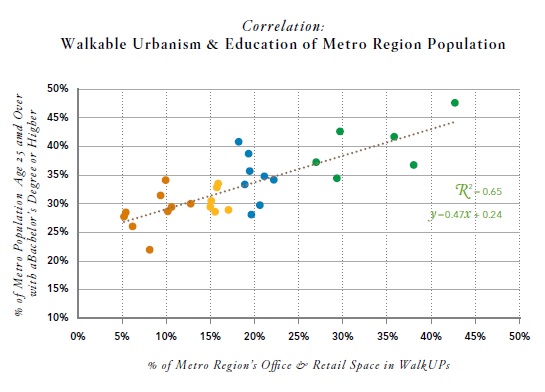
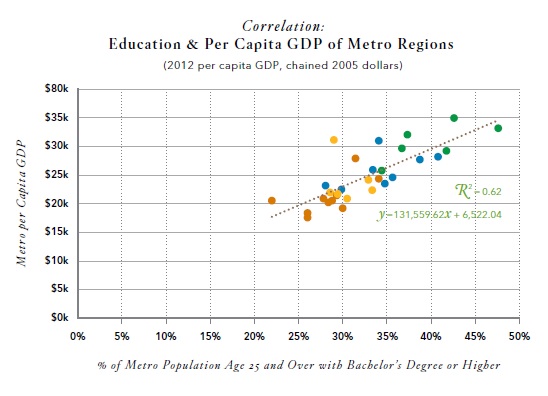
In the report it found that regions with more walkable urbanism also had higher GDP performance, and that those same regions tended to have higher educational attainment.
“Given the relationship between educational attainment and walkable urbanism, and the relationship between educational attainment and per capita GDP, it is not surprising that walkable urbanism and per capita GDP are also positively correlated.”
According to the report, the six highest-ranked regions have a per capita GDP approximately 38% higher than the 10 lowest-ranked regions.
Of course, these findings alone cannot indicate whether walkable urbanism causes highly educated persons to move or stay away from certain regions, or whether places become more walkable due to there being more highly educated people there. But the correlations are strong enough that it is something that should make regional business and political leaders rethink the way in which Cincinnati develops.
“Although more research needs to be done to understand why walkable urbanism is correlated with higher per capita GDPs and education levels, this evidence suggests that encouraging walkable urbanism is a potential strategy for regional economic development.”