Categories
Up To Speed

The huge demographic shift that is changing the face of America

The huge demographic shift that is changing the face of America.

Between 2000 and 2013, an additional 78 counties throughout the United States joined the rank of those where whites no longer made up a majority of the population. In total there are some 266 counties nation-wide, including Ohio’s three most populous. More from CityLab:

By 2040, the country’s white population will no longer be the majority. But for many regions around the country, this demographic shift has already arrived. A new map created by the Pew Research Center pinpoints the 78 counties in 19 states where, from 2000 to 2013, minorities together outnumbered the white population.

Pew crunched Census numbers from the 2,440 U.S. counties that had more than 10,000 residents in 2013. Whites made up less than half the population in a total of 266 counties. Even though these 266 counties made up only 11 percent of the counties analyzed, they contained 31 percent of the country’s total population, with many of them home to dense urban areas.

Categories
Up To Speed

American cities should be more concerned about spreading poverty, not gentrification

American cities should be more concerned about spreading poverty, not gentrification.

Gentrification is one of those topics that is difficult to write about. Simply mentioning the word or hinting at its existence is sure to stir the pot and draw a wildfire of comments, both defending and condemning it. What is often left out of the discussion, however, is that the gentrification we all imagine in our minds when we hear the word is essentially confined to just three metropolitan regions in America. As a result, the bigger concern for most cities should actually be their widespread poverty. More from Vox:

That share of people living in high-poverty neighborhoods isn’t huge — around 8.9 percent of all Americans living in poverty in 2010, according to US Census Bureau data. But the population of high-poverty neighborhoods has doubled since 1970, from 2 to 4 million. Over that same period, the US population as a whole grew by around 50 percent. In addition, the number of high-poverty census tracts in cities nearly tripled from 1,100 to 3,100.

As City Observatory highlights, we often think of gentrification as a big threat to urban areas, driving up the cost of living for people living in poorer areas and eventually forcing them out. You would think that’d lead to a lot of these neighborhoods rebounding out of poverty, albeit with mixed consequences for people there originally. But it appears the bigger threat by far is neighborhoods remaining mired in poverty and new neighborhoods falling into it.

Categories
Month in Review

Month in Review – June 2014

We Are Walnut Hills 3UrbanCincy‘s most popular stories in June were clear signs of the progress being made in Cincinnati. While a modest number of new residents have been added over the past four years, the urban core and surrounding neighborhoods continue to grow with new residential developments.

Two of the stories (#2 and #5) are in sharp contrast: while Cincinnati received national praise for its form-based code efforts, Norwood missed an opportunity and ended up with an auto-oriented development in its core.

As you enjoy your Independence Day weekend, we invite you to catch up on our top stories from June that you may have missed:

    1. Cincinnati Posts Population Gain for Second Consecutive Year
      The city has added about 1,000 new residents since 2010.
    2. Cincinnati Wins National Planning Award for Form-Based Code
      Jocelyn Gibson reports back from her trip to the 22nd Congress for the New Urbanism (CNU).
    3. New Apartments, Retail Space Coming to Peeble’s Corner in Walnut Hills
      “The whole goal here is to create a concentrated effort, like what 3CDC has done in Over-the-Rhine, and reach that critical mass in Walnut Hills.”
    4. Work on $30M Corryville Apartment Project On-Pace for Fall 2015 Completion
      Uptown Cincinnati continues to molt and grow, and Randy Simes reports on the latest 300-bed Uptown Rental Properties development.
    5. Paycor’s Brand New Headquarters in Norwood Misses the Mark
      In a guest editorial, Norwood resident James Bonsall explains that the latest phase of the Linden Pointe on the Lateral development turns its back on bikes and pedestrians.


Categories
Business Development News

What Influence Does Population Density Have on Neighborhood Improvement?

Data from the Cleveland Branch of the Federal Reserve Bank shows that a poor neighborhood’s income growth, while affected by internal factors, is also highly influenced by its surrounding metropolitan area.

Much the same that a poor family in a strong neighborhood is more likely to be lifted up by the rising tide in their neighborhood, it seems that poor areas of cities have the ability to function in the same manner.

The data from the Federal Reserve measures neighborhood growth, or lack thereof, from 1980 to 2008. Several statistics from the report come as a surprise.

First, while the report finds that a neighborhood’s percentage of residents with a high school degree, bachelor’s degree, and its unemployment rate in 1980 all have some correlation with that neighborhood’s chances of having income growth, the statistics are not all that strong.

The difference in bachelor’s degrees between neighborhoods with no income improvement and those with a high degree of income improvement was around 3%. Meanwhile, the unemployment rate was only about 2% lower in high income growth neighborhoods.

But perhaps the most striking evidence, at the local level, is how much population density correlates with a neighborhood’s likeliness to achieve high income growth.

Neighborhoods that had no improvement had, on average, a density of 12,028 people per square mile in 1980, while neighborhoods with high improvement had an average density more than double that of 30,399 people per square mile.

The City of Cincinnati, by comparison, has a population density around 3,810 people per square mile.

By 2008, the change is stark. Neighborhoods that received high income growth increased their educational attainment, population and population density at a much higher rate than what the report classifies as no-improvement neighborhoods.

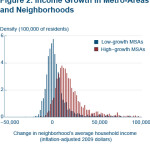
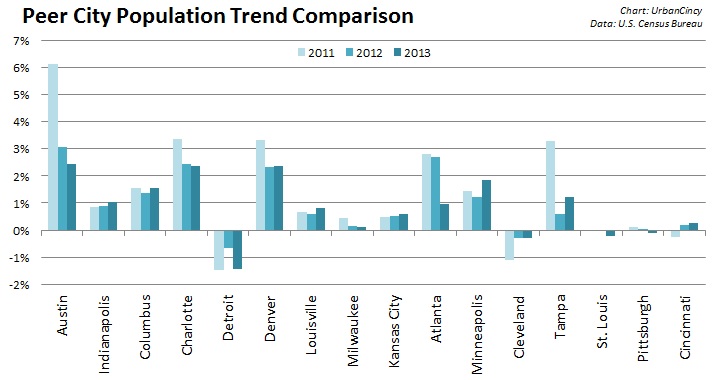
The report also found that poor neighborhoods in low-growth metropolitan statistical areas (MSA) were more likely to remain stagnant or even shrink while poor neighborhoods in high-growth MSAs had a higher chance of experiencing income growth.

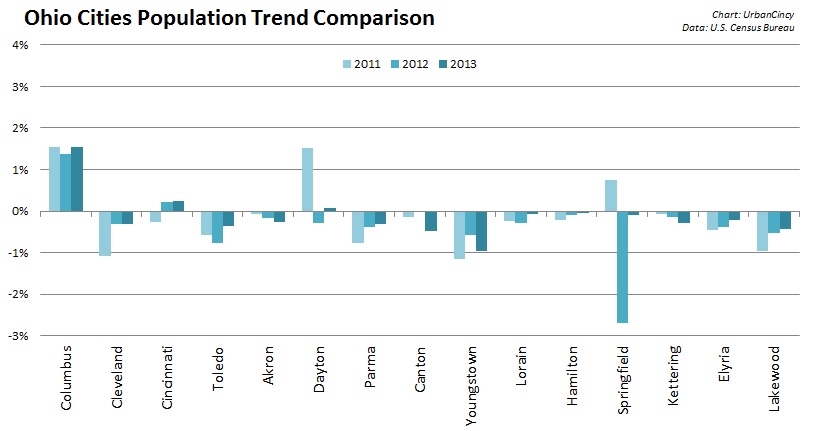
Growing at just 0.4% annually since the 2010 Census, the Cincinnati MSA would fall into that low-growth category.

While the average income of an MSA in 1980 may not be a good predictor of whether a neighborhood will experience high or low growth, neighborhoods that experienced high income growth were located in regions that experienced higher growth in income, a growing population and increased their population density.

As a result, two identical poor neighborhoods in New York City and Cleveland in 1980 would look much different in 2008, despite being in the same position 38 years prior. The assertion is that a growing metropolitan area has a tendency to lift the tide for all neighborhoods.

The Federal Reserve Bank of Cleveland points out, however, that some of this improvement in high-growth neighborhoods could be due to what they deem residential sorting; basically, changing demographics in the neighborhood.

While the evidence is not certain, the data also shows neighborhoods that experienced high-growth from 1980 to 2008 were also more likely to have gained residents (10%) than low-growth neighborhoods (-20.9%). Therefore, neighborhoods that experienced high growth were those that also had the greatest opportunity for demographic shifts to occur within the neighborhood.

Interestingly enough, while much of the gentrification argument has centered on white residents pushing out minorities, the report found that neighborhoods that experienced high growth rates were more likely to reduce their share of black and white residents, while increasing their share of Hispanic residents.

These trends have wide implications for American policy regarding poverty and urban development, but appear to be less relevant in the Cincinnati region where very few neighborhoods have any sizable Hispanic population.

With this strong evidence indicating population density is linked to a poor neighborhood’s ability to improve, it only reinforces the growing narrative about the suburbanization of poverty in America.

Still, however, there is a long way to go before this narrative is fully realized locally; as it is estimated that roughly half of all children in the City of Cincinnati live in poverty – a number that does not appear to be changing.

While policy makers at City Hall will surely be discussing youth jobs programs, career training, early childhood education and neighborhood health centers, one other item on the policy agenda should be the urban form of our region’s neighborhoods.

We do not know whether higher population densities were a cause or merely correlated with a neighborhood’s ability to improve, but we do know, thanks to this data from the Federal Reserve, that the two issues appear to be more connected than what we may have previously thought.

Categories
Business Development News

Cincinnati Posts Population Gain for Second Consecutive Year

Cincinnati has added about 1,000 new people since the decennial census in 2010, according to new estimates released by the U.S. Census Bureau.

The modest increase comes from two consecutive years of population gains that followed an immediate downward revision after the 2010 Census. The increase also means that just Cincinnati, Columbus and Dayton were the only big cities (more than 50,000 people) in Ohio to post gains.

Columbus and Cincinnati, meanwhile, were the only big cities to post population gains for the past two years.

The population estimates are derived using the 2010 Census as a baseline and then factoring in new permitted residential construction and mobile homes, and subtracting out the estimated number of homes lost each year. As a result, all of the annual estimates should come with a grain of salt.

Ohio Cities Comparison

With that said, Dayton’s population gains appear to be an anomaly, while the increases in Columbus and Cincinnati appear to be more rooted. In any case, the news for Ohio’s big cities is not good as the rest all lost population, especially those in the northeastern part of the state.

Columbus continues to stand out from the rest of Ohio’s big cities in terms of its population trends. In this latest estimate release, Columbus posted the fifteenth largest numeric population gain of any municipality in America; and it comes on the heels of equally impressive gains in prior years.

Some observers, however, would attribute some of the gains in Columbus to its unusually large municipal boundaries that include what would be far suburbs in other Ohio regions.

While Columbus has been growing by about 1.5% annually over the past several years, Cincinnati has been growing annually by about 0.25%.

When compared with other peer cities, Cincinnati’s gains look even more tepid.

Peer Cities Comparison

Of fifteen other cities competitive with Cincinnati, the city bested only five of them in terms of population growth, while being significantly outperformed by most all others. In this comparison, even Ohio’s best performer – Columbus –fares only reasonably well against the field.

For Cincinnati’s peer cities, national trends appear to hold true. Southern cities continue to grow at the fastest clip, but their growth rates are leveling off. In our comparison, Austin, Atlanta and Tampa have all experienced significant declines in annual population growth since the 2010 Census. Charlotte has also experienced a similar trend, but appears to be holding steady more so than its Sun Belt peers.

Meanwhile, while many Midwestern cities continue to lose population, they are doing so at a slower rate or have stopped the losses entirely.

As we previously examined on UrbanCincy, the Cincinnati region continues to grow by about 0.4% annually. The City of Cincinnati’s 2013 gain represents approximately 12.5% of the total regional population growth, and half of Hamilton County’s increase last year.

In a nutshell, Cincinnati is over performing regionally, but under performing amongst its peers. If Cincinnati were growing as fast as Charlotte or Austin, the city would be adding around 9,000 new people every year.